SQL Console
SQL console is the fastest and easiest way to explore and query your databases in ClickHouse Cloud. You can use the SQL console to:
- Connect to your ClickHouse Cloud Services
- View, filter, and sort table data
- Execute queries and visualize result data in just a few clicks
- Share queries with team members and collaborate more effectively.
Opening SQL Console from Control Plane
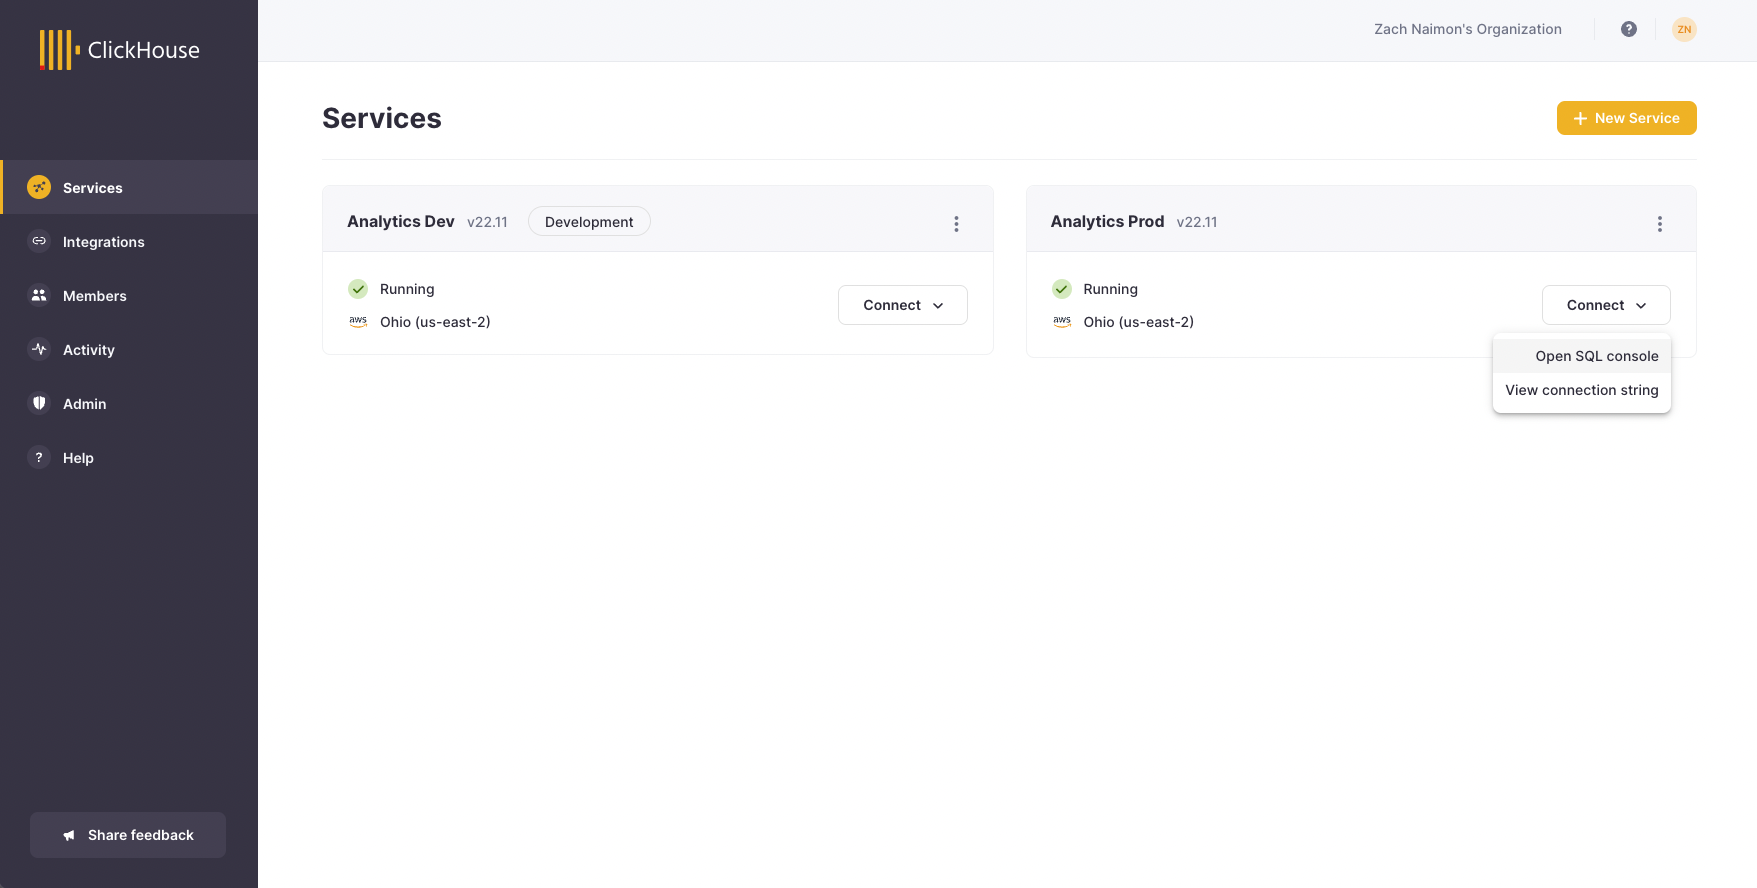
The SQL console can be opened directly from your Service overview screen. Simply click the ‘Connect’ button and select ‘Open SQL console’.
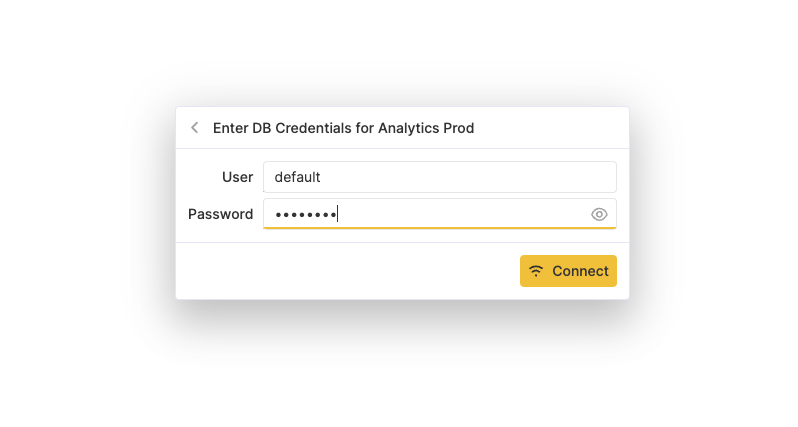
The SQL Console will open in a new tab and prompt you to input your service credentials:
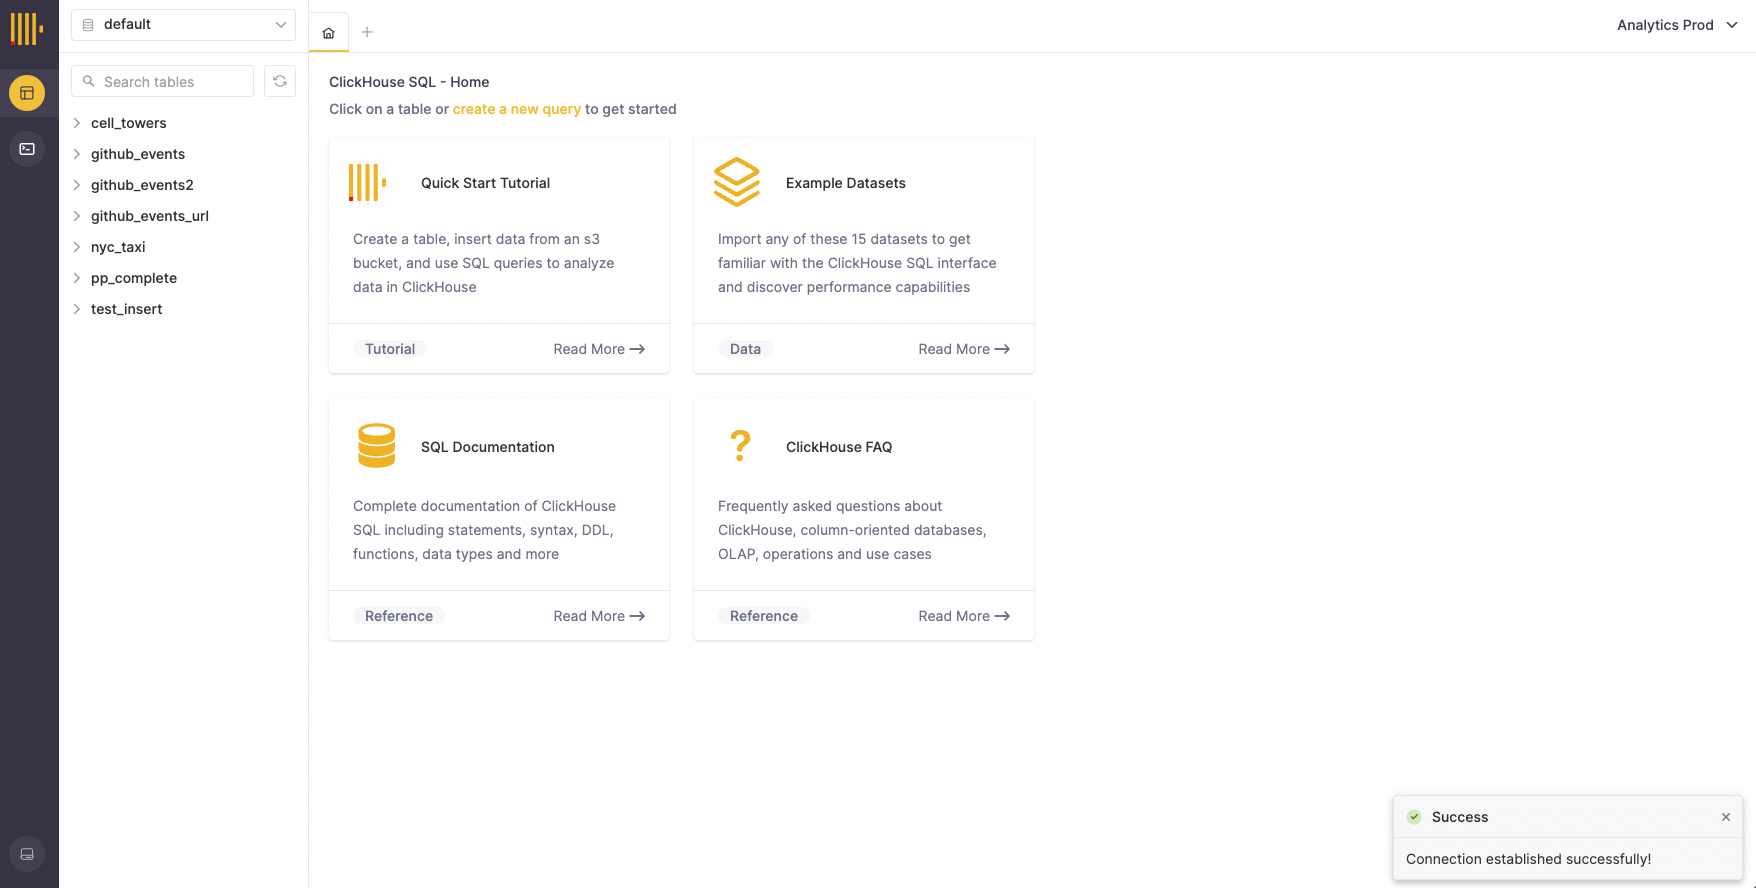
After inputting your credentials, click ‘Connect’ and the SQL Console will attempt to connect and authenticate. If this is successful, you should now be able to see the SQL Console interface:
Loading the SQL Console Directly
The SQL Console can also be loaded directly by navigating to https://console.clickhouse.cloud. After logging into your ClickHouse Cloud account, you will be presented with a list of services. Select one and enter your service credentials on the service authentication screen:
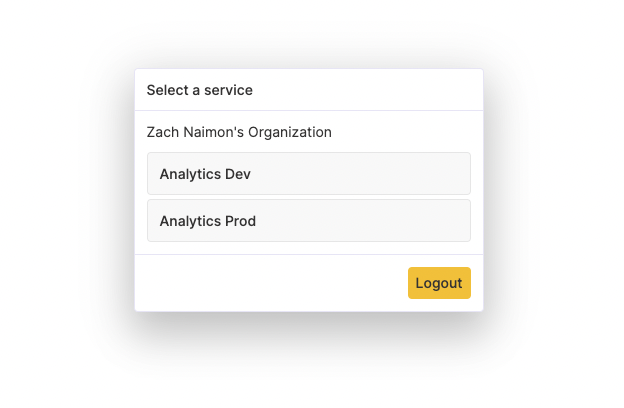
If only one service exists in your organization, the SQL Console will immediately direct you to the service authentication screen
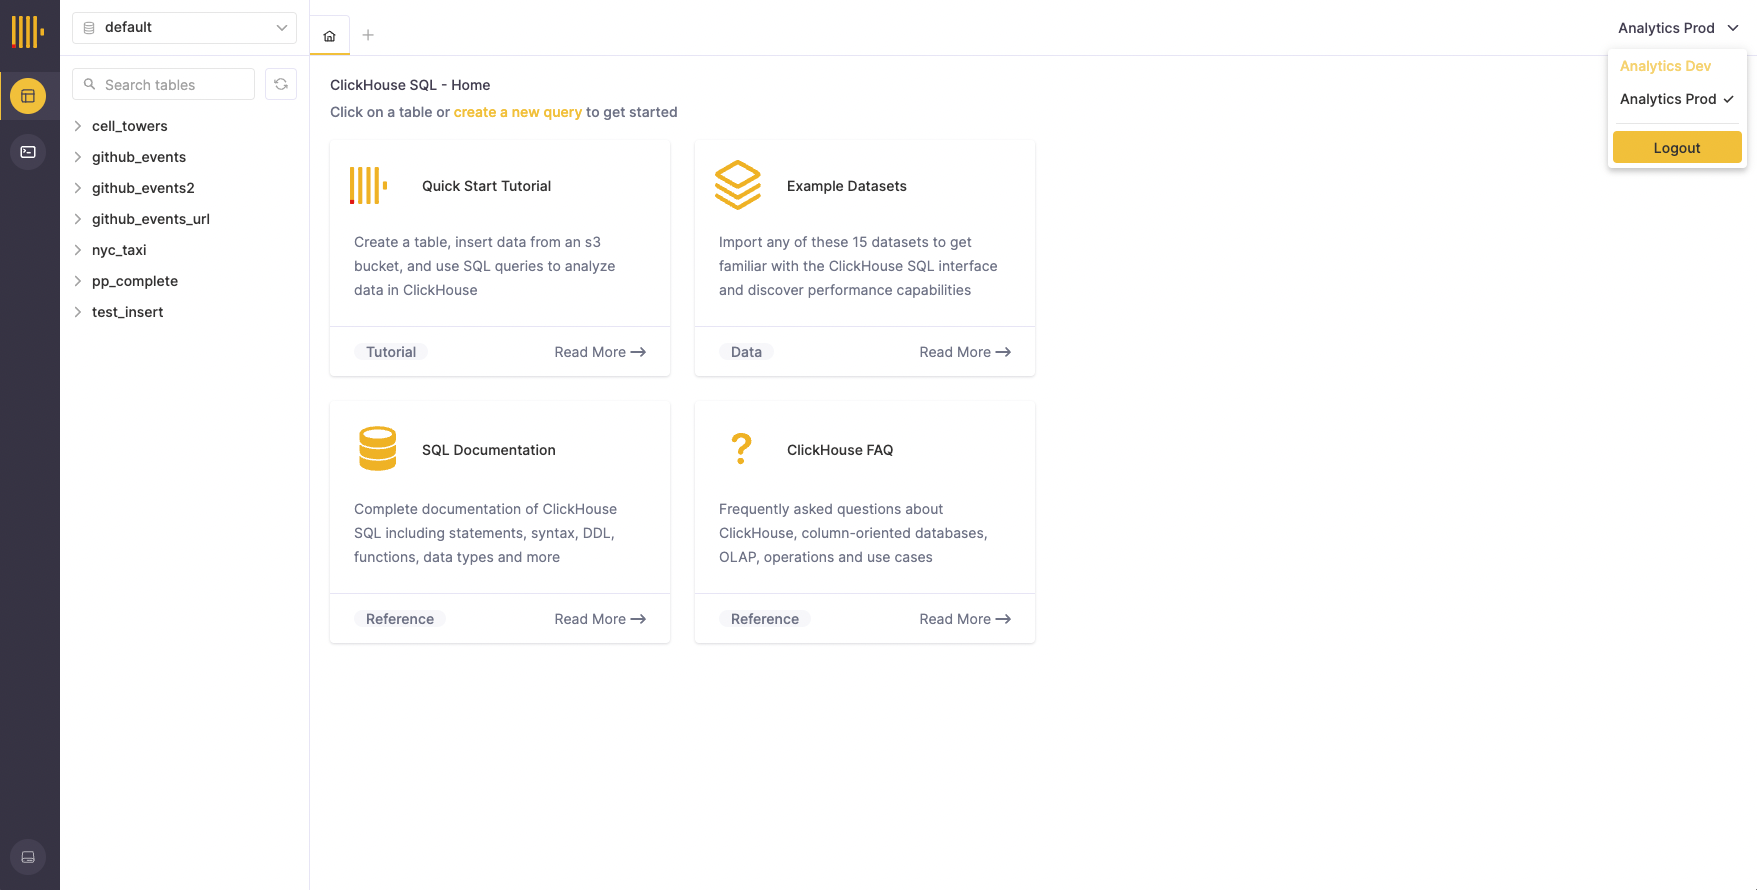
Using the service switcher
You can easily switch between your services directly from the SQL Console. Simply open the service switcher in the top right corner of the Console and select a different service:
Exploring Tables
Viewing Table List and Schema Info
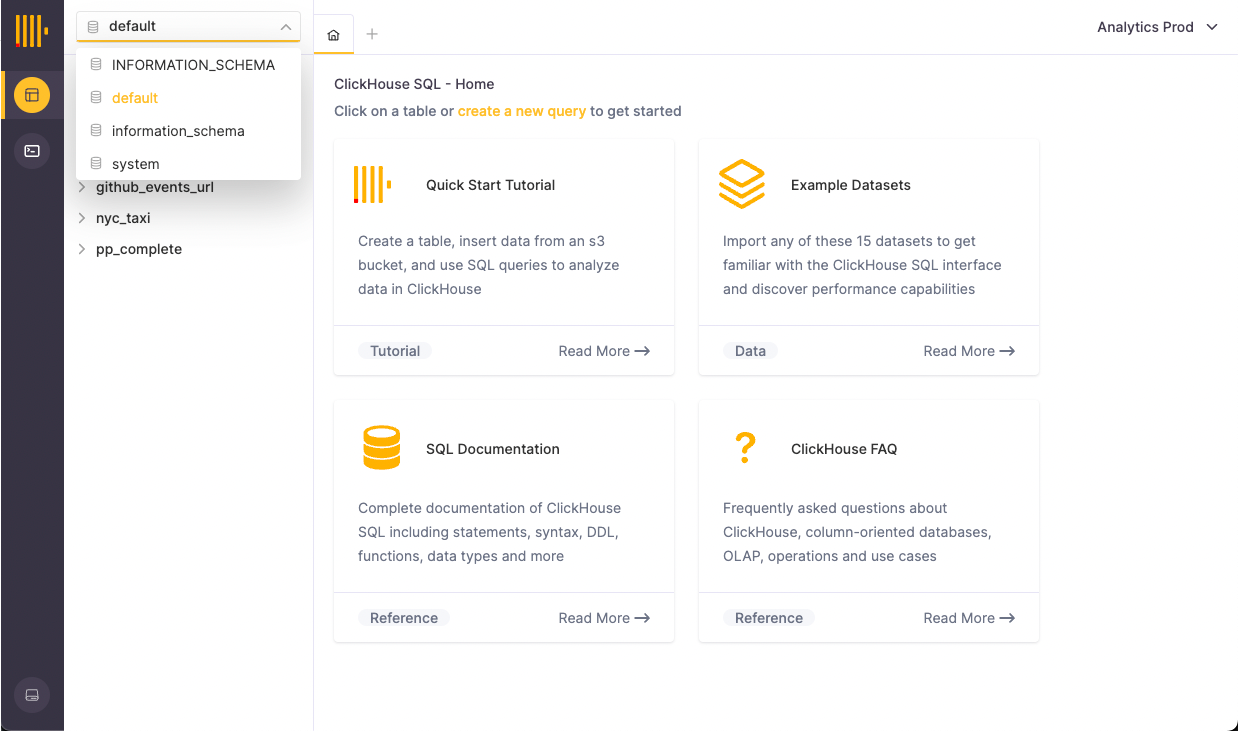
An overview of tables contained in your ClickHouse instance can be found in the left sidebar area. Use the database selector at the top of the left bar to view the tables in a specific database
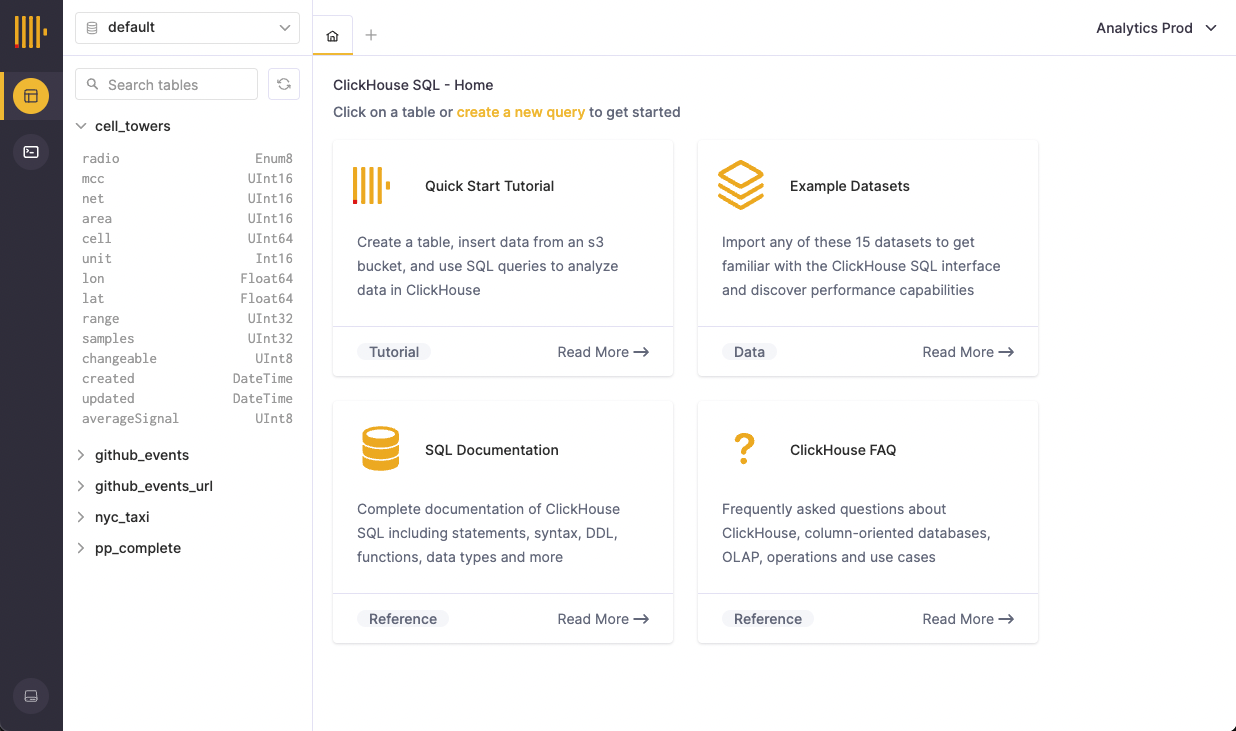
Tables in the list can also be expanded to view columns and types
Exploring Table Data
Click on a table in the list to open it in a new tab. In the Table View, data can be easily viewed, selected, and copied. Note that structure and formatting are preserved when copy-pasting to spreadsheet applications such as Microsoft Excel and Google Sheets. You can flip between pages of table data (paginated in 30-row increments) using the navigation in the footer.
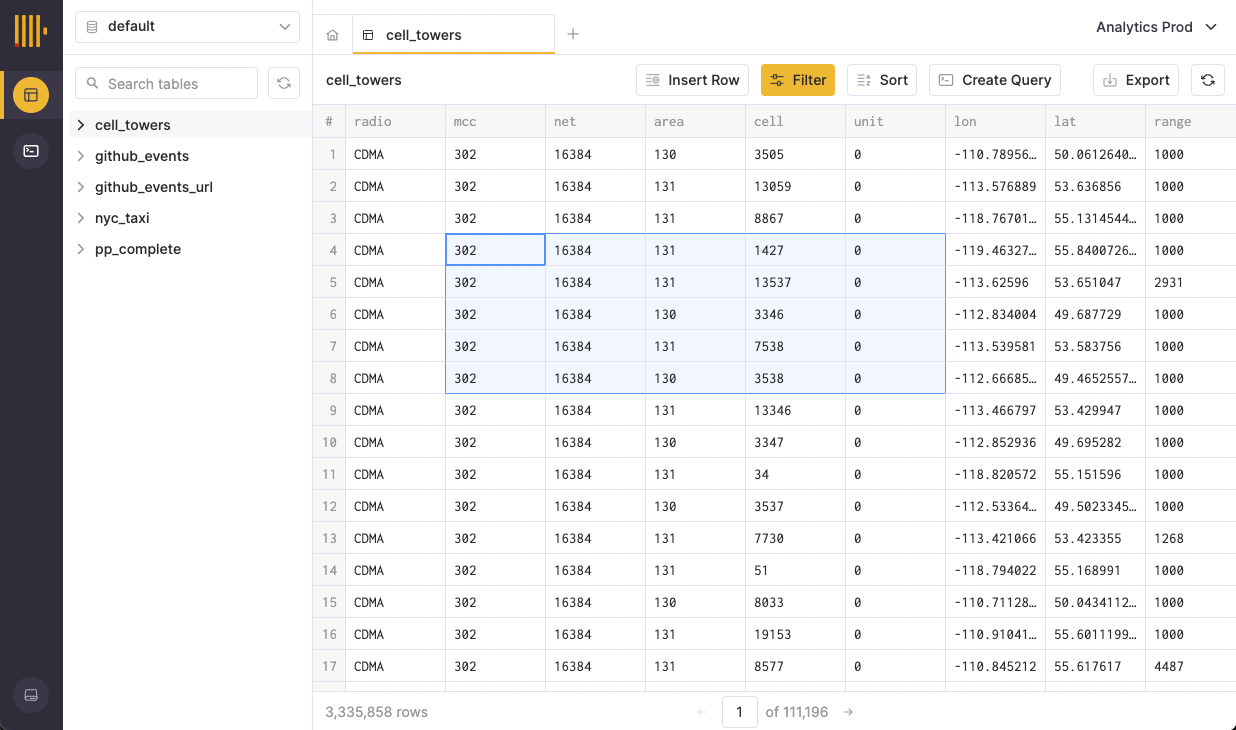
Inspecting Cell Data
The Cell Inspector tool can be used to view large amounts of data contained within a single cell. To open it, right-click on a cell and select ‘Inspect Cell’. The contents of the cell inspector can be copied by clicking the copy icon in the top right corner of the inspector contents.
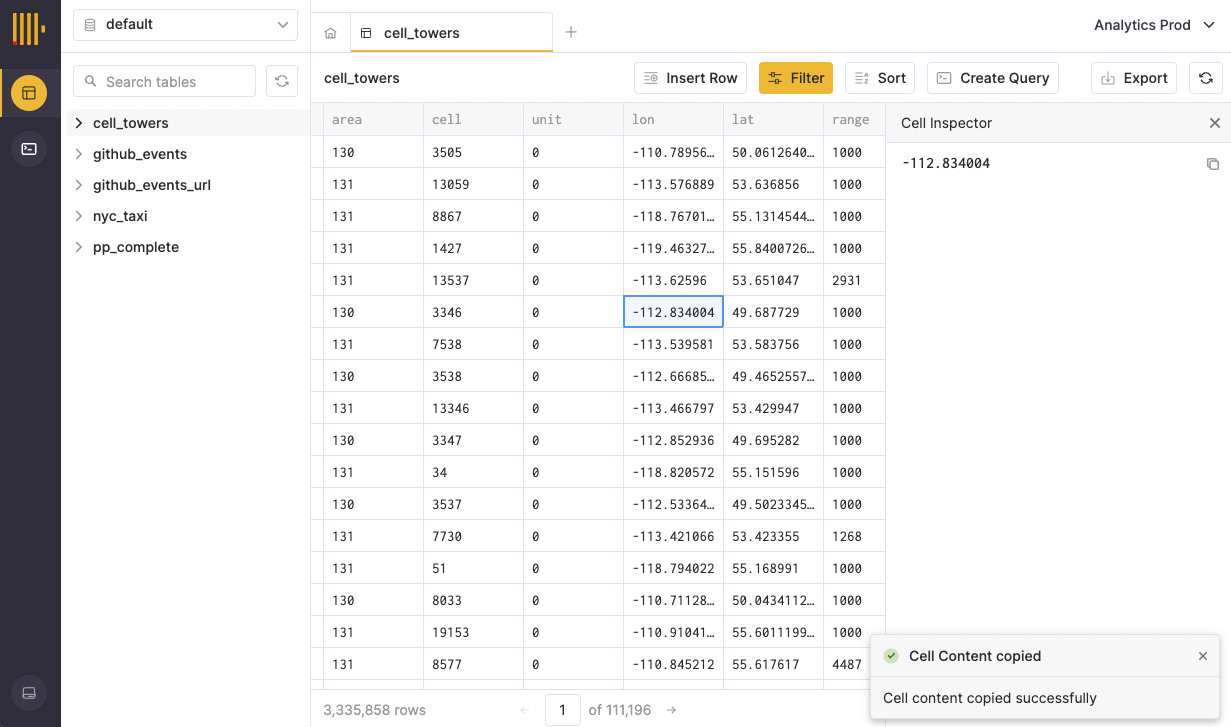
Filtering and Sorting Tables
Sorting a table
To sort a table in the SQL console, open a table and select the ‘Sort’ button in the toolbar. This button will open a menu that will allow you to configure your sort. You can choose a column by which to sort and configure the ordering of the sort (ascending or descending). Select ‘Apply’ or press Enter to sort your table
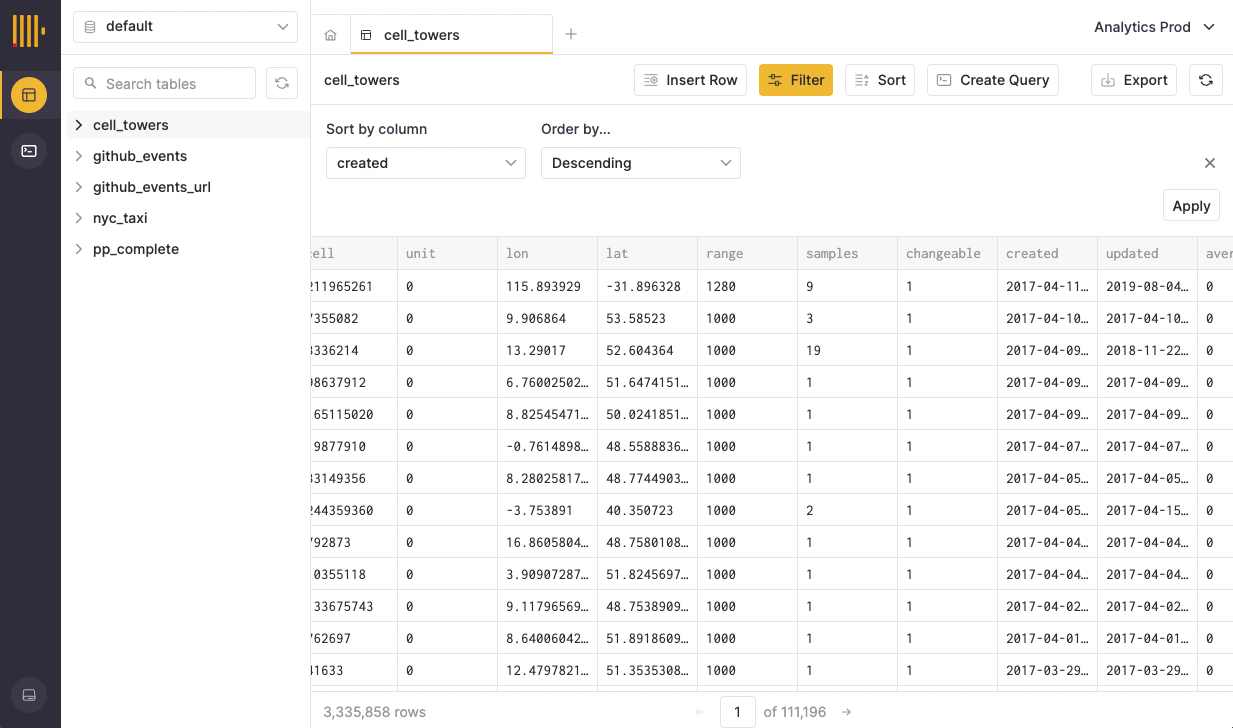
The SQL console also allows you to add multiple sorts to a table. Click the ‘Sort’ button again to add another sort. Note: sorts are applied in the order that they appear in the sort pane (top to bottom). To remove a sort, simply click the ‘x’ button next to the sort.
Filtering a table
To filter a table in the SQL console, open a table and select the ‘Filter’ button. Just like sorting, this button will open a menu that will allow you to configure your filter. You can choose a column by which to filter and select the necessary criteria. The SQL console intelligently displays filter options that correspond to the type of data contained in the column.
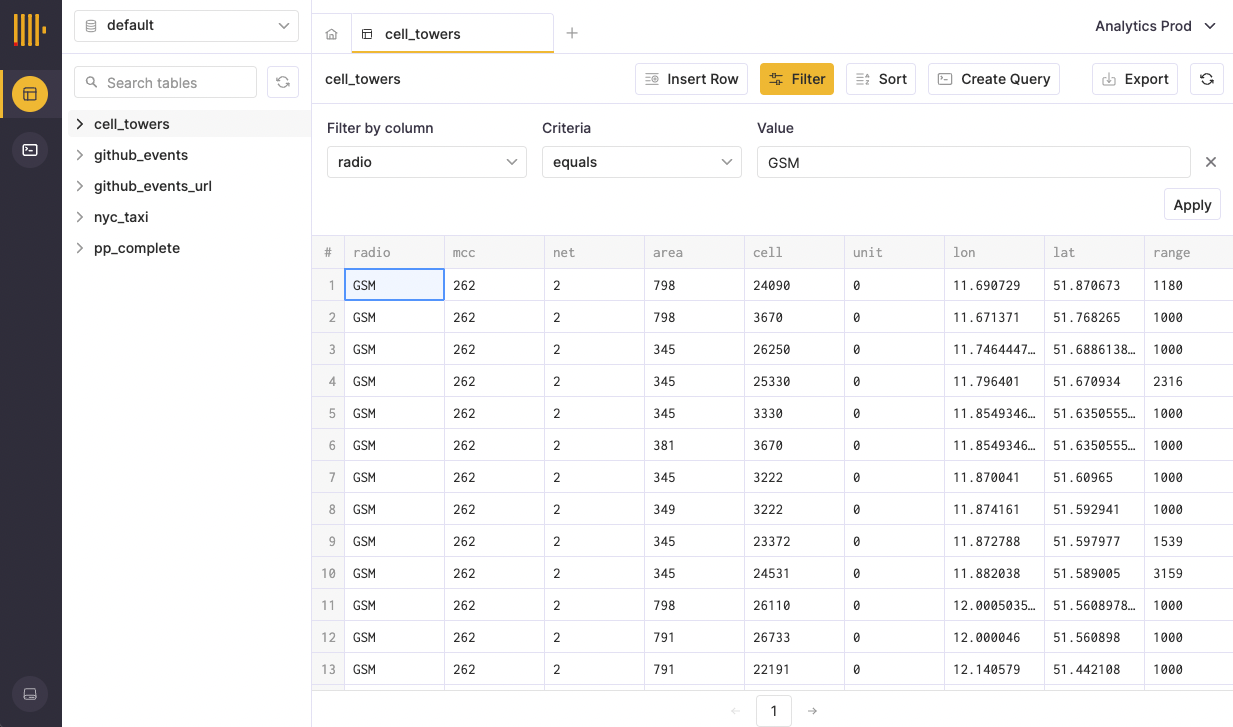
When you’re happy with your filter, you can select ‘Apply’ to filter your data. You can also add additional filters as shown below.
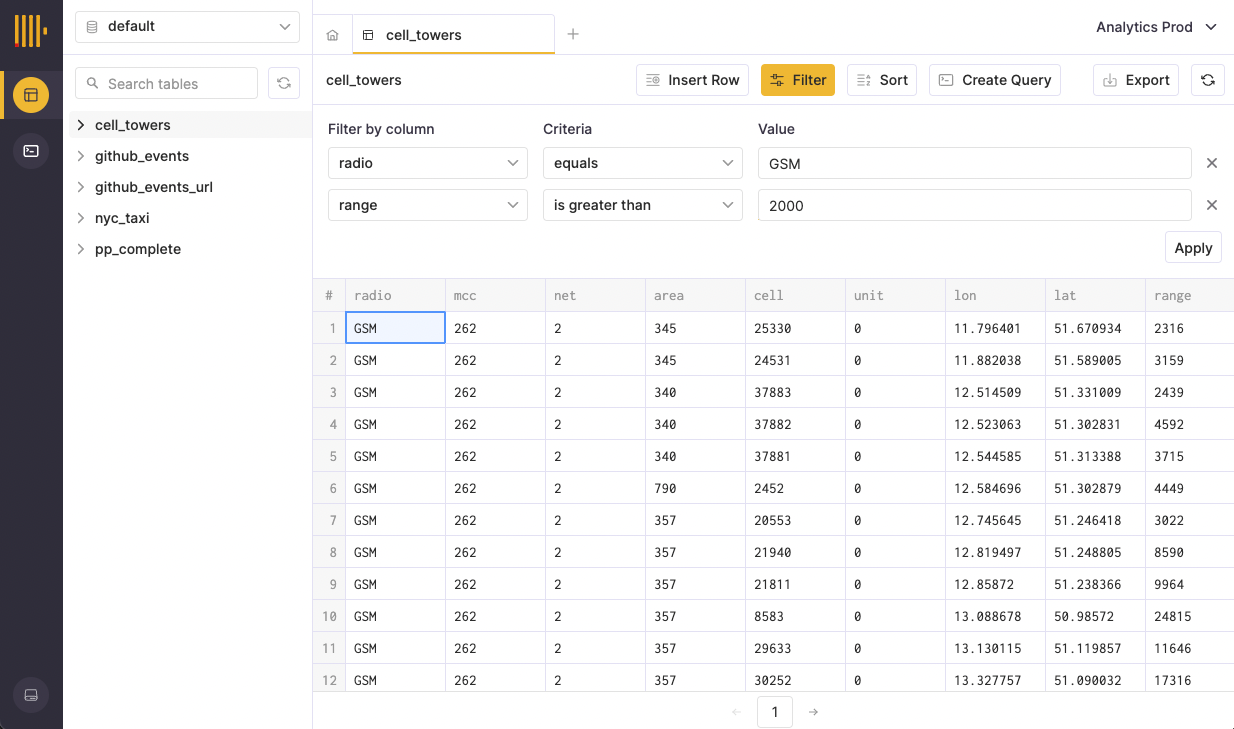
Similar to the sort functionality, click the ‘x’ button next to a filter to remove it.
Filtering and sorting together
The SQL console allows you to filter and sort a table at the same time. To do this, add all desired filters and sorts using the steps described above and click the ‘Apply’ button.
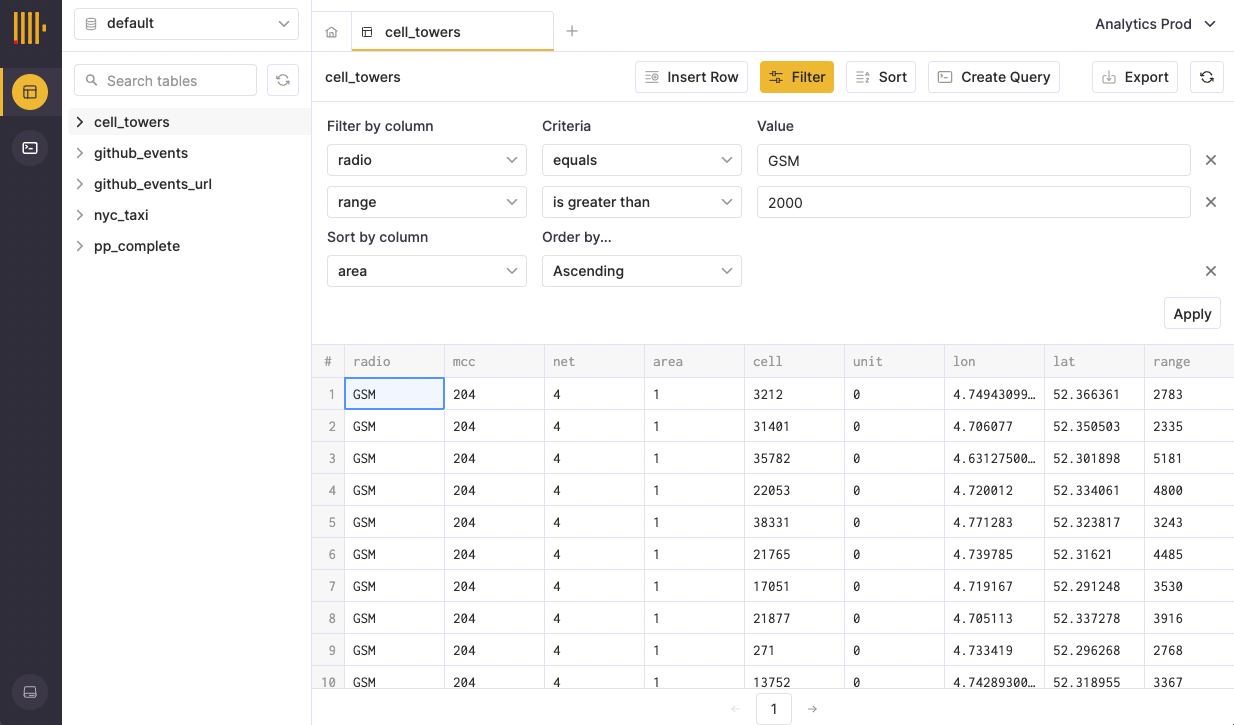
Creating a query from filters and sorts
The SQL console can convert your sorts and filters directly into queries with one click. Simply select the ‘Create Query’ button from the toolbar with the sort and filter parameters of your choosing. After clicking ‘Create query’, a new query tab will open pre-populated with the SQL command corresponding to the data contained in your table view.
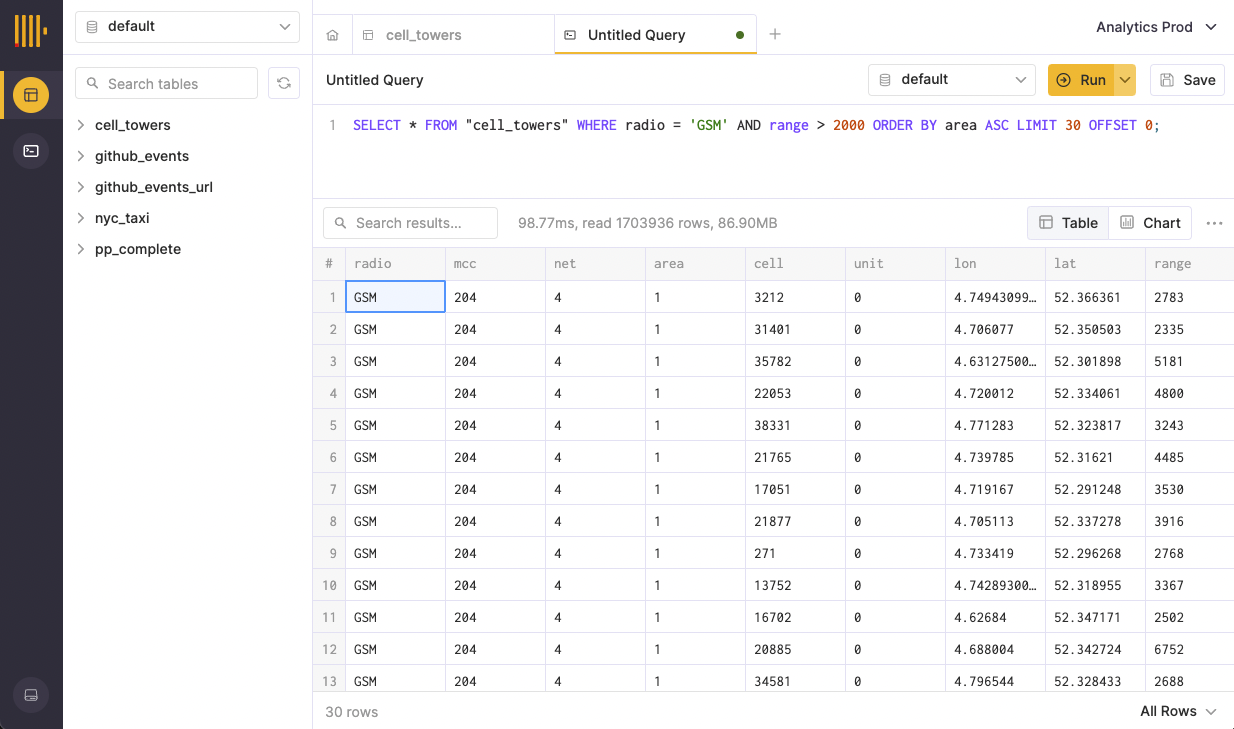
Filters and sorts are not mandatory when using the ‘Create Query’ feature.
You can learn more about querying in the SQL console by reading the (link) query documentation.
Creating and Running a Query
Creating a Query
There are two ways to create a new query in the SQL console.
Click the ‘+’ button in the tab bar
Select the ‘New Query’ button from the left sidebar query list
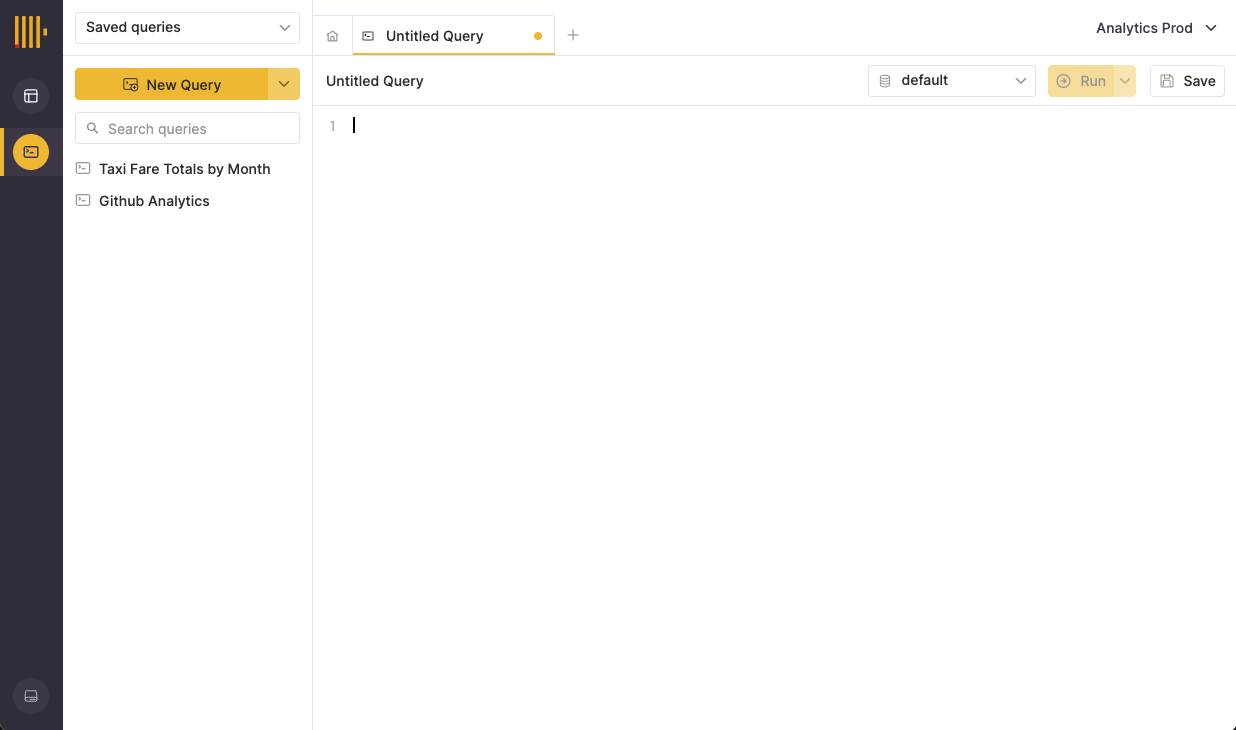
Running a Query
To run a query, type your SQL command(s) into the SQL Editor and click the ‘Run’ button or use the shortcut cmd / ctrl + enter. To write and run multiple commands sequentially, make sure to add a semicolon after each command.
Query Execution Options By default, clicking the run button will run all commands contained in the SQL Editor. The SQL console supports two other query execution options:
- Run selected command(s)
- Run command at the cursor
To run selected command(s), highlight the desired command or sequence of commands and click the ‘Run’ button (or use the cmd / ctrl + enter shortcut). You can also select ‘Run selected’ from the SQL Editor context menu (opened by right-clicking anywhere within the editor) when a selection is present.
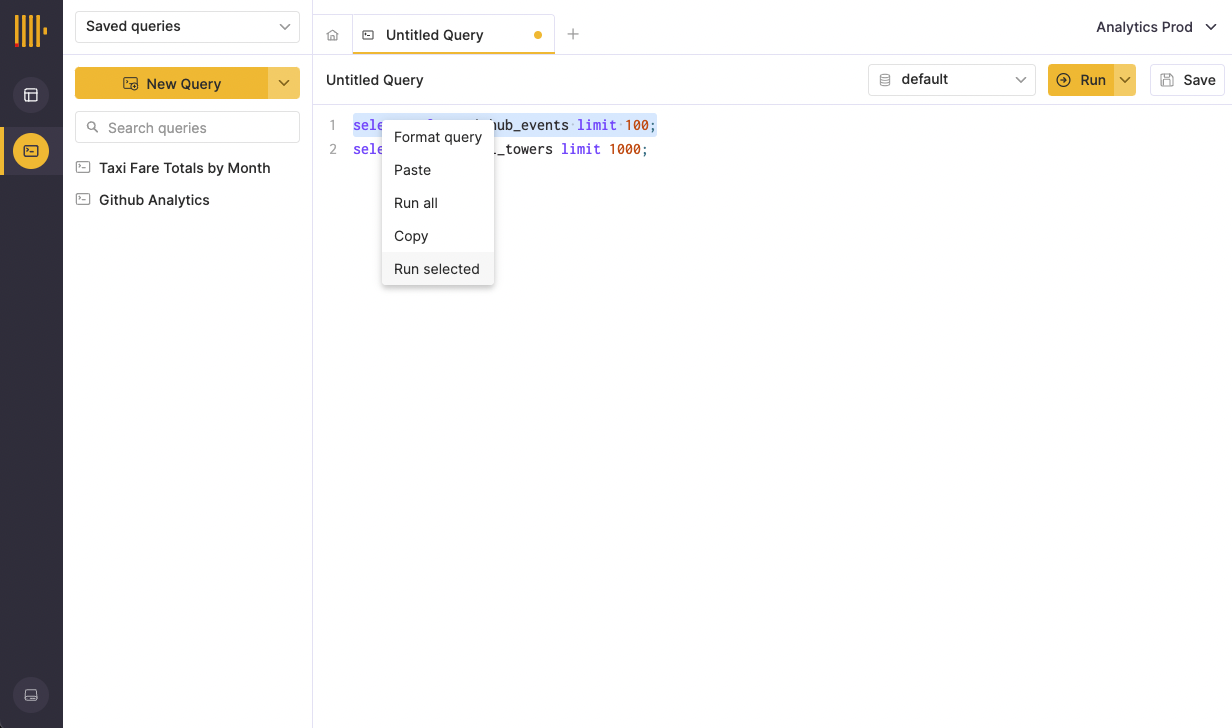
Running the command at the current cursor position can be achieved in two ways:
Select ‘At Cursor’ from the extended run options menu (or use the corresponding
cmd / ctrl + shift + enterkeyboard shortcut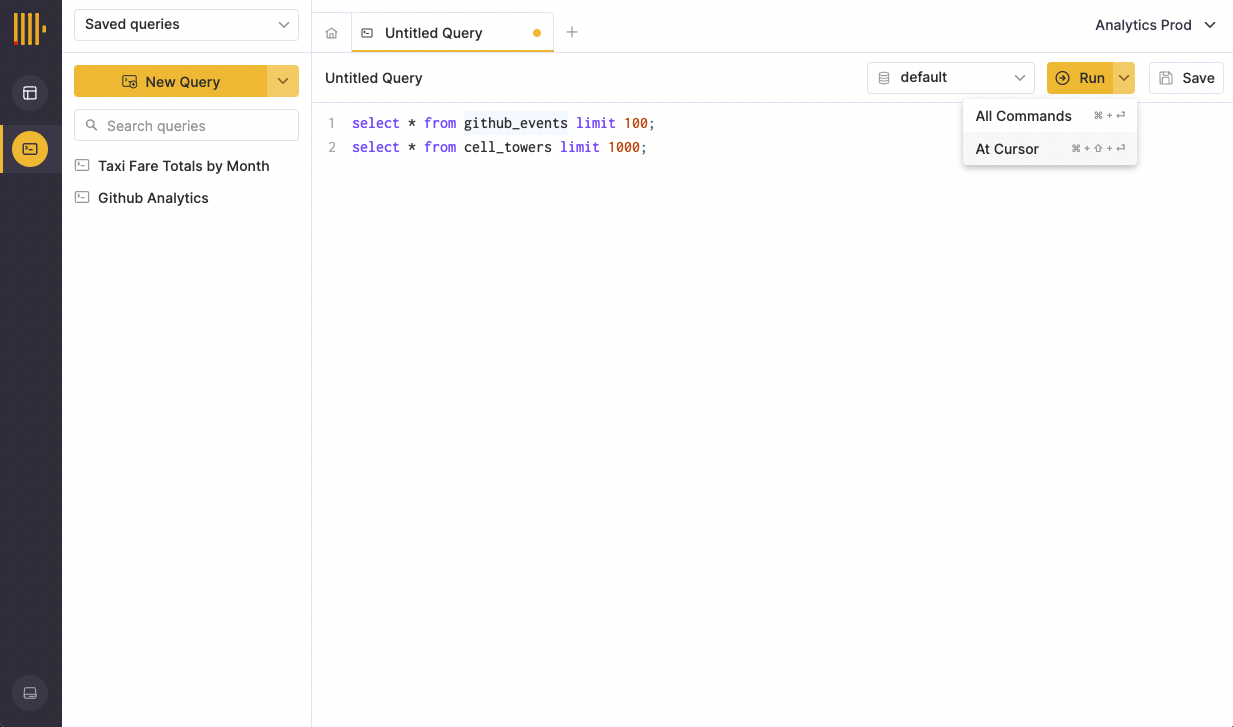
Selecting ‘Run at cursor’ from the SQL Editor context menu
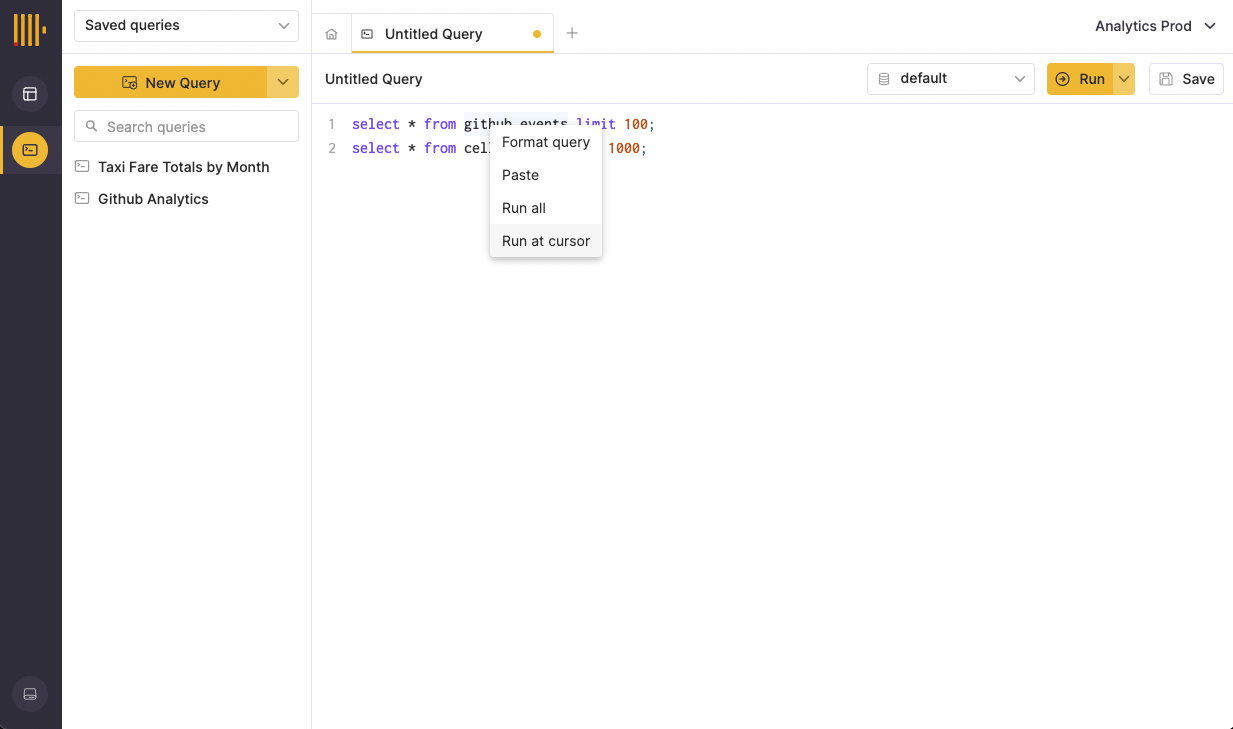
The command present at the cursor position will flash yellow on execution.
Canceling a Query
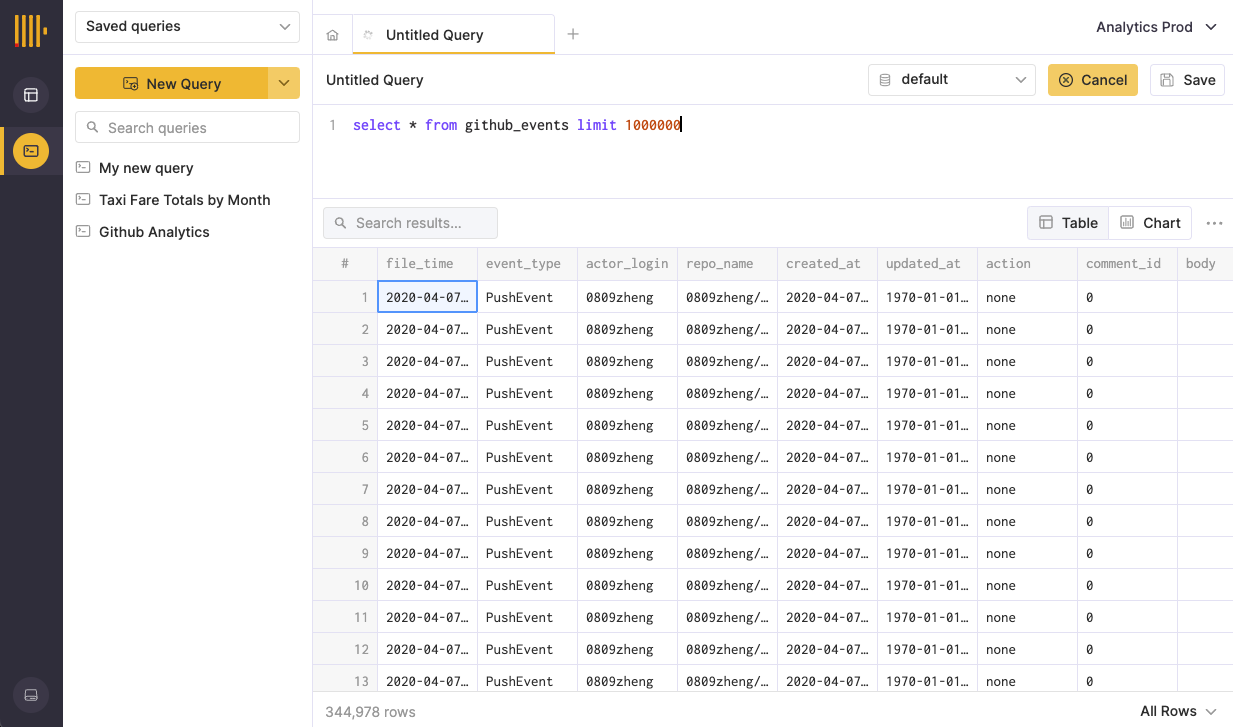
While a query is running, the ‘Run’ button in the Query Editor toolbar will be replaced with a ‘Cancel’ button. Simply click this button or press Esc to cancel the query. Note: Any results that have already been returned will persist after cancellation.
Saving a Query
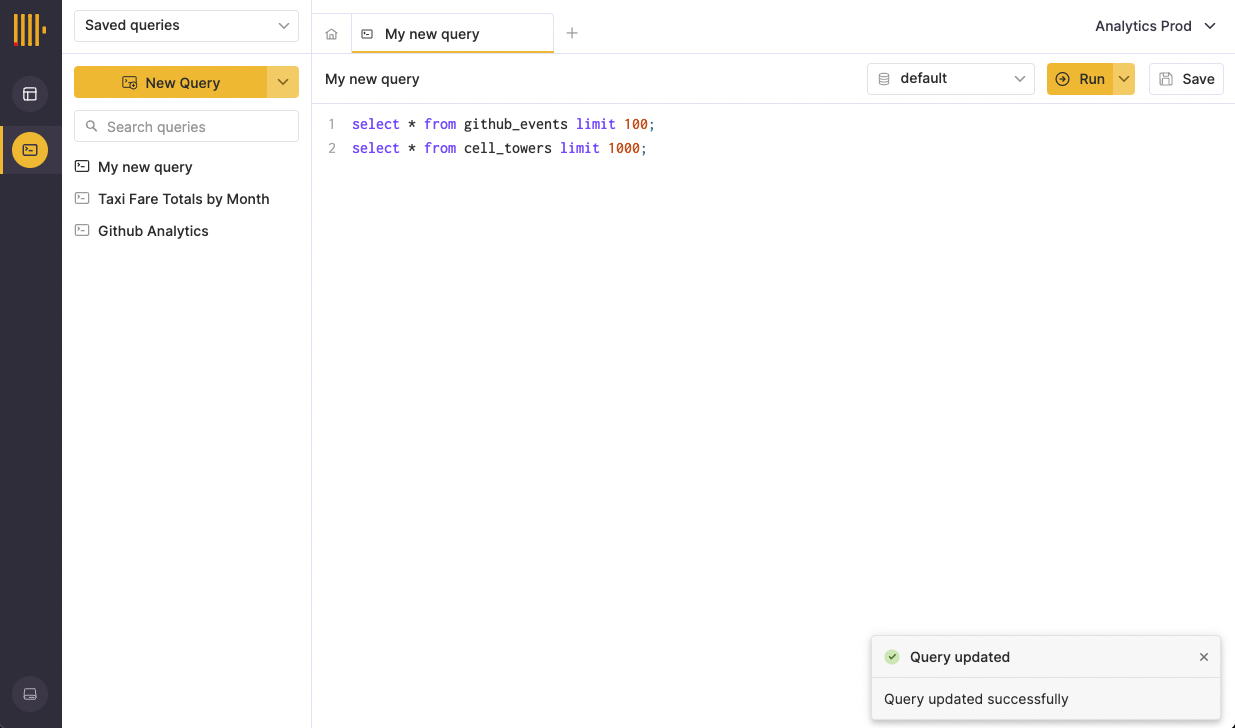
If not previously named, your query should be called ‘Untitled Query’. Click on the query name to change it. Renaming a query will cause the query to be saved.
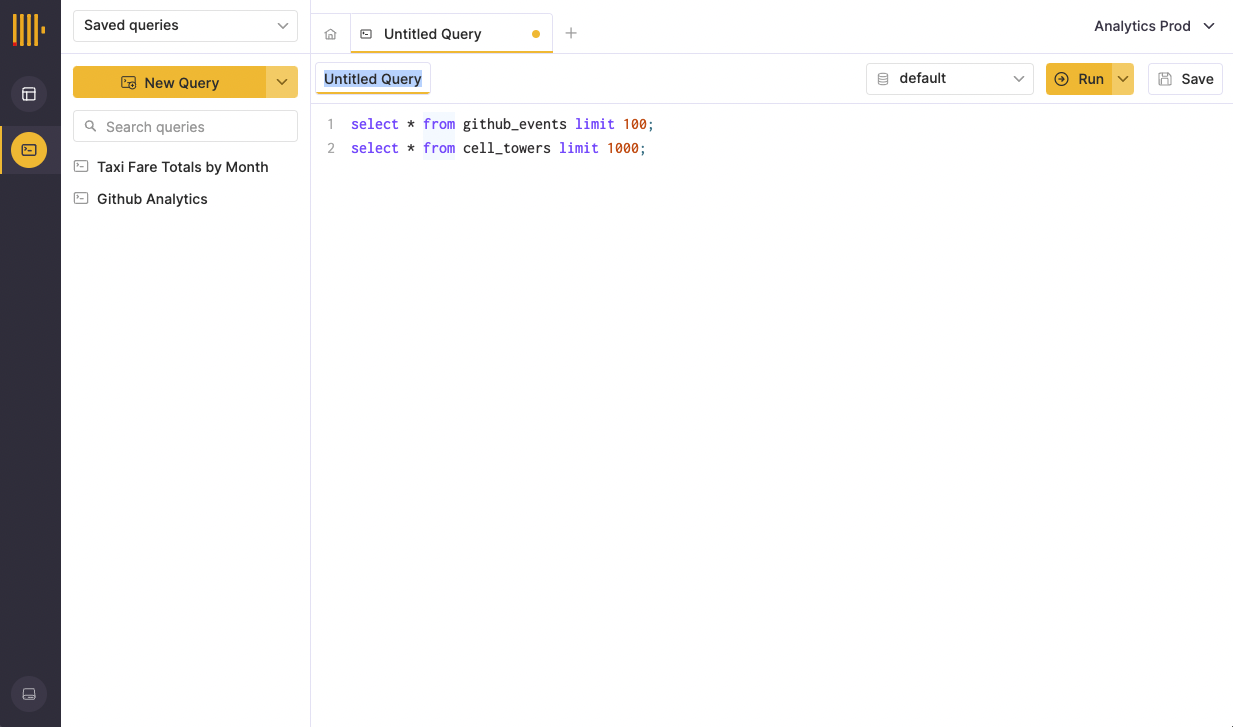
You can also use the save button or cmd / ctrl + s keyboard shortcut to save a query.
Using GenAI to manage queries
This feature allows users to write queries as natural language questions and have the query console create SQL queries based on the context of the available tables. GenAI can also help users debug their queries.
For more information on GenAI, checkout the Announcing GenAI powered query suggestions in ClickHouse Cloud blog post.
Table setup
Let's import the UK Price Paid example dataset and use that to create some GenAI queries.
Open a ClickHouse Cloud service.
Create a new query by clicking the + icon.
Paste and run the following code:
CREATE TABLE uk_price_paid
(
    price UInt32,
    date Date,
    postcode1 LowCardinality(String),
    postcode2 LowCardinality(String),
    type Enum8('terraced' = 1, 'semi-detached' = 2, 'detached' = 3, 'flat' = 4, 'other' = 0),
    is_new UInt8,
    duration Enum8('freehold' = 1, 'leasehold' = 2, 'unknown' = 0),
    addr1 String,
    addr2 String,
    street LowCardinality(String),
    locality LowCardinality(String),
    town LowCardinality(String),
    district LowCardinality(String),
    county LowCardinality(String)
)
ENGINE = MergeTree
ORDER BY (postcode1, postcode2, addr1, addr2);
This query should take around 1 second to complete. Once it's done, you should have an empty table called `uk_price_paid.
Create a new query and paste the following query:
INSERT INTO uk_price_paid
WITH
   splitByChar(' ', postcode) AS p
SELECT
    toUInt32(price_string) AS price,
    parseDateTimeBestEffortUS(time) AS date,
    p[1] AS postcode1,
    p[2] AS postcode2,
    transform(a, ['T', 'S', 'D', 'F', 'O'], ['terraced', 'semi-detached', 'detached', 'flat', 'other']) AS type,
    b = 'Y' AS is_new,
    transform(c, ['F', 'L', 'U'], ['freehold', 'leasehold', 'unknown']) AS duration,
    addr1,
    addr2,
    street,
    locality,
    town,
    district,
    county
FROM url(
    'http://prod.publicdata.landregistry.gov.uk.s3-website-eu-west-1.amazonaws.com/pp-complete.csv',
    'CSV',
    'uuid_string String,
    price_string String,
    time String,
    postcode String,
    a String,
    b String,
    c String,
    addr1 String,
    addr2 String,
    street String,
    locality String,
    town String,
    district String,
    county String,
    d String,
    e String'
) SETTINGS max_http_get_redirects=10;
This query grabs the dataset from the gov.uk website. This file is ~4GB, so this query will take a few minutes to complete. Once ClickHouse has processed the query, you should have the entire dataset within the uk_price_paid table.
Query creation
Let's create a query using natural language.
Select the uk_price_paid table, and then click Create Query.
Click Generate SQL. You may be asked to accept that your queries are sent to Chat-GPT. You must select I agree to continue.
You can now use this prompt to enter a natural language query and have ChatGPT convert it into an SQL query. In this example we're going to enter:
Show me the total price and total number of all uk_price_paid transactions by year.
The console will generate the query we're looking for and display it in a new tab. In our example, GenAI created the following query:
-- Show me the total price and total number of all uk_price_paid transactions by year.
SELECT year(date), sum(price) as total_price, Count(*) as total_transactions
FROM uk_price_paid
GROUP BY year(date)
Once you've verified that the query is correct, click Run to execute it.
Keep in mind that GenAI is an experimental feature. Use caution when running GenAI-generated queries against any dataset.
Debugging
Now, let's test the query debugging capabilities of GenAI.
Create a new query by clicking the + icon and paste the following code:
-- Show me the total price and total number of all uk_price_paid transactions by year.
SELECT year(date), sum(pricee) as total_price, Count(*) as total_transactions
FROM uk_price_paid
GROUP BY year(date)
Click Run. The query fails since we're trying to get values from
priceeinstead ofprice.Click Fix Query.
GenAI will attempt to fix the query. In this case, it changed
priceetoprice. It also realised thattoYearis a better function to use in this scenario.Select Apply to add the suggested changes to your query and click Run.
Keep in mind that GenAI is an experimental feature. Use caution when running GenAI-generated queries against any dataset.
Advanced Querying Features
Searching query results
After a query is executed, you can quickly search through the returned result set using the search input in the result pane. This feature assists in previewing the results of an additional WHERE clause or simply checking to ensure that specific data is included in the result set. After inputting a value into the search input, the result pane will update and return records containing an entry that matches the inputted value. In this example, we’ll look for all instances of alexey-milovidov in the github_events table for the ClickHouse repo:
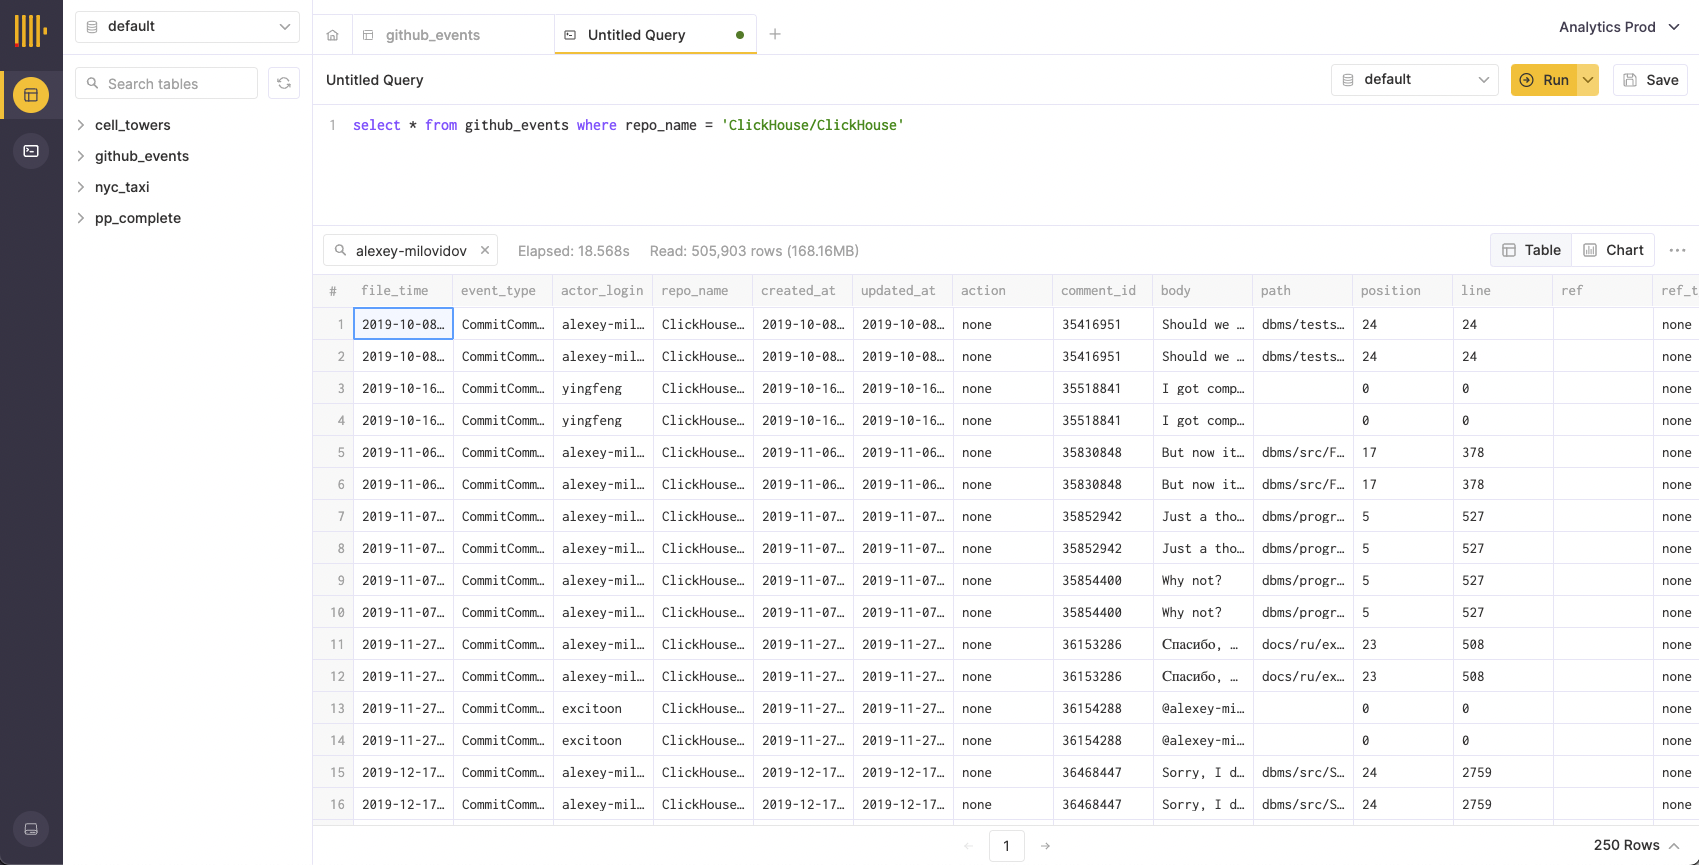
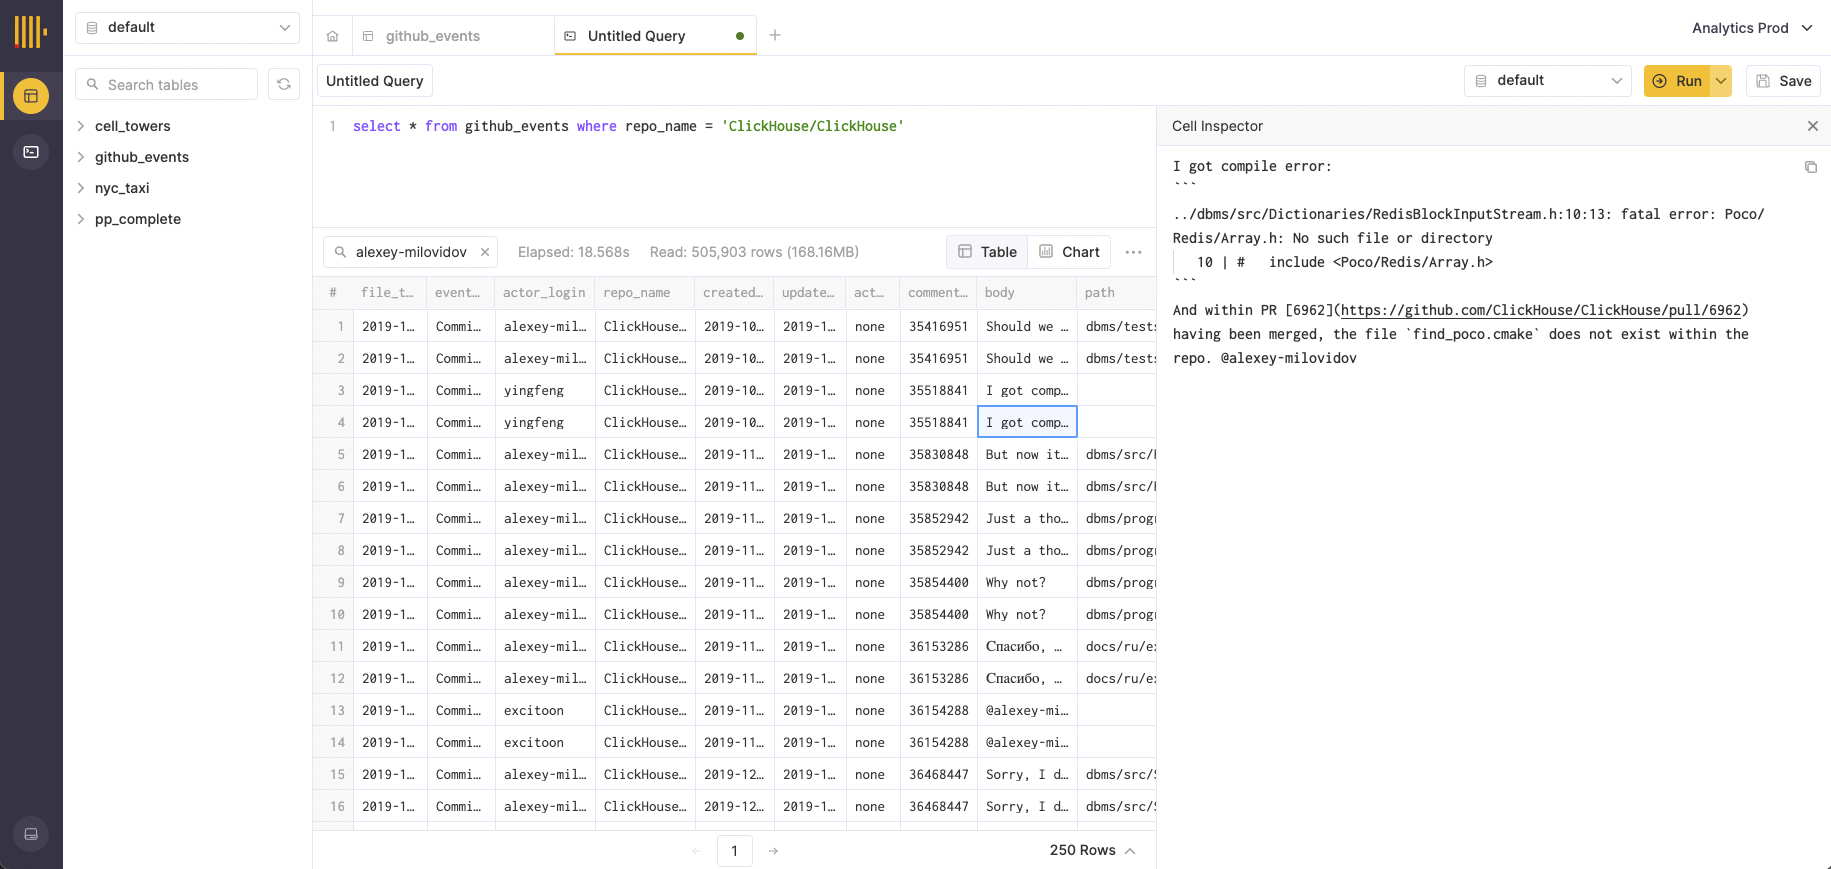
Note: Any field matching the inputted value will be returned. For example, the third record in the above screenshot does not match ‘alexey-milovidov’ in the actor_login field, but the body field does:
Adjusting pagination settings
By default, the query result pane will display every result record on a single page. For larger result sets, it may be preferable to paginate results for easier viewing. This can be accomplished using the pagination selector in the bottom right corner of the result pane:
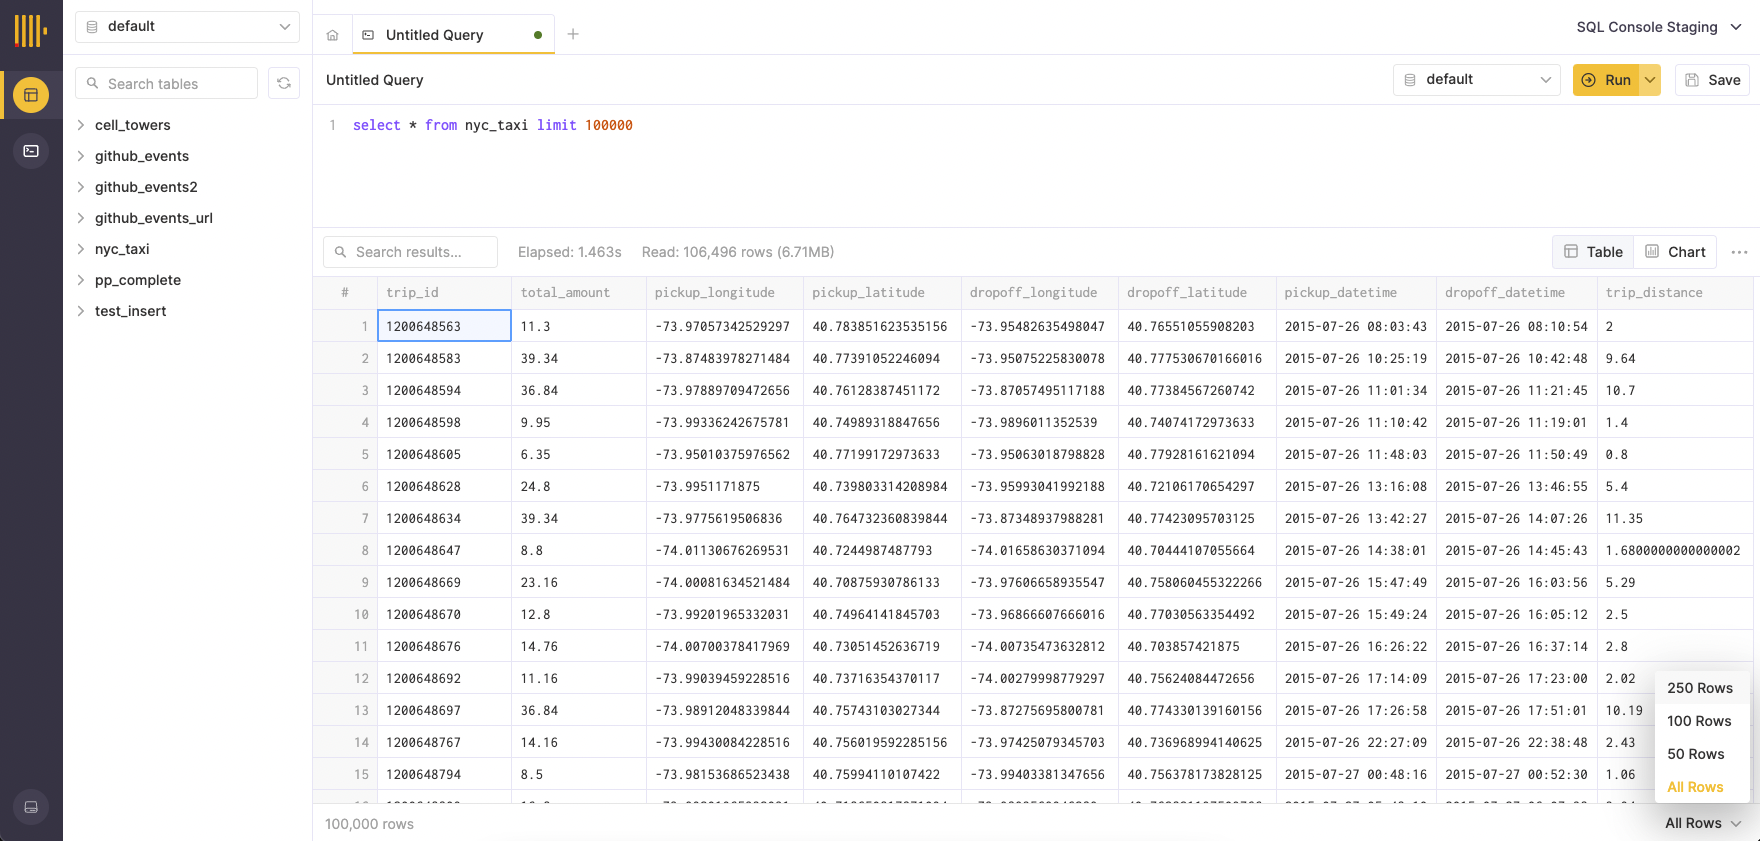
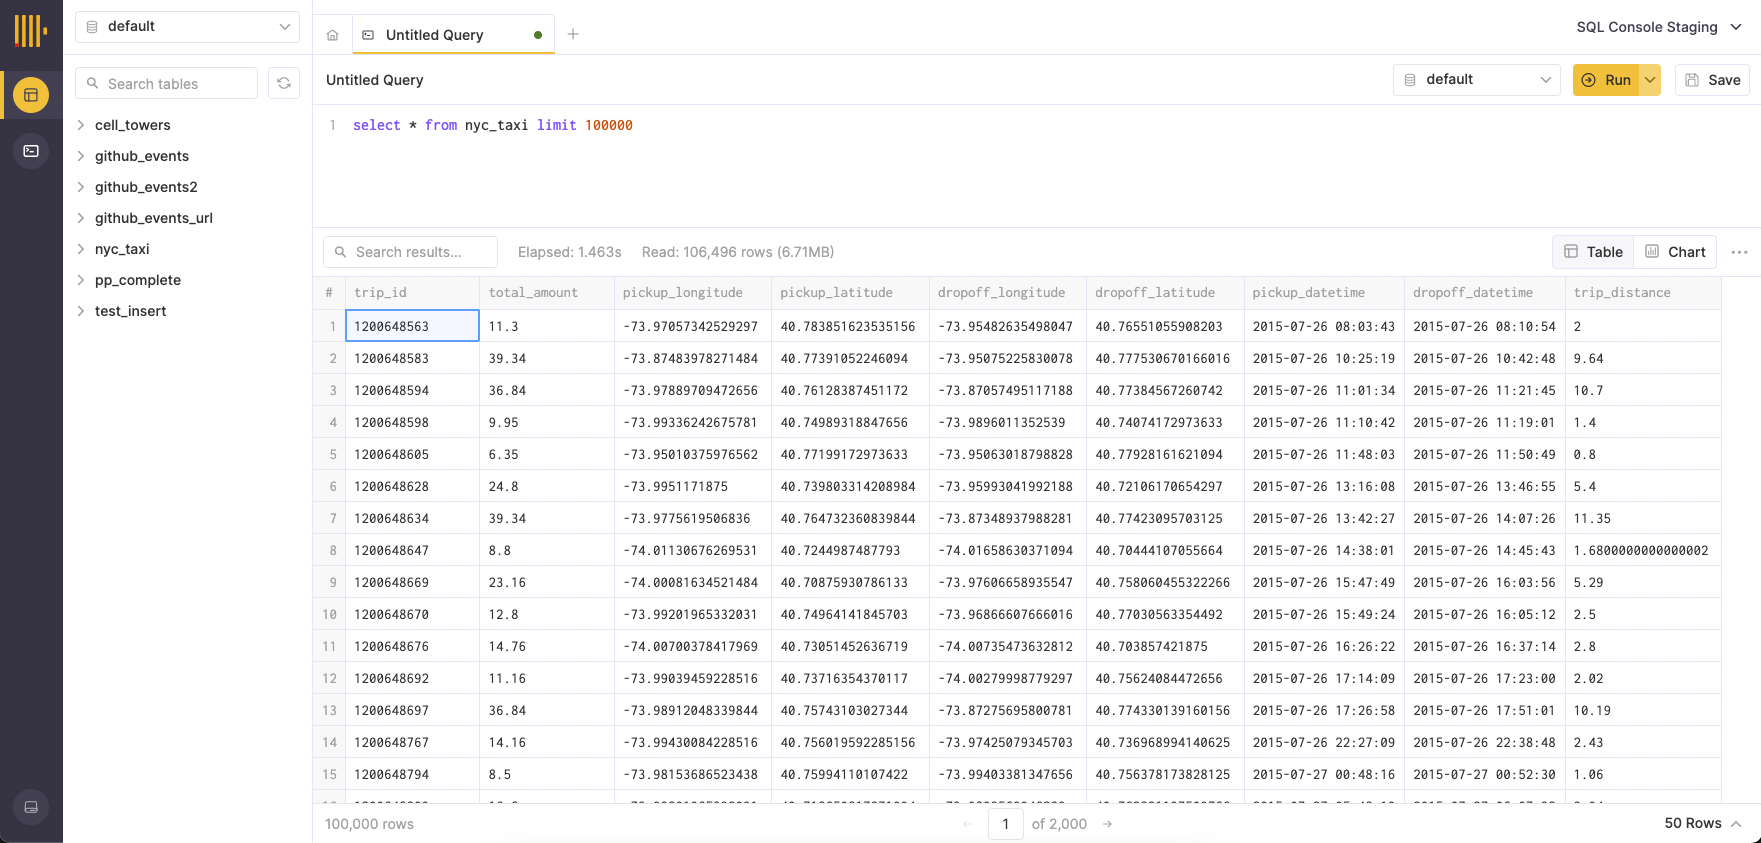
Selecting a page size will immediately apply pagination to the result set and navigation options will appear in the middle of the result pane footer
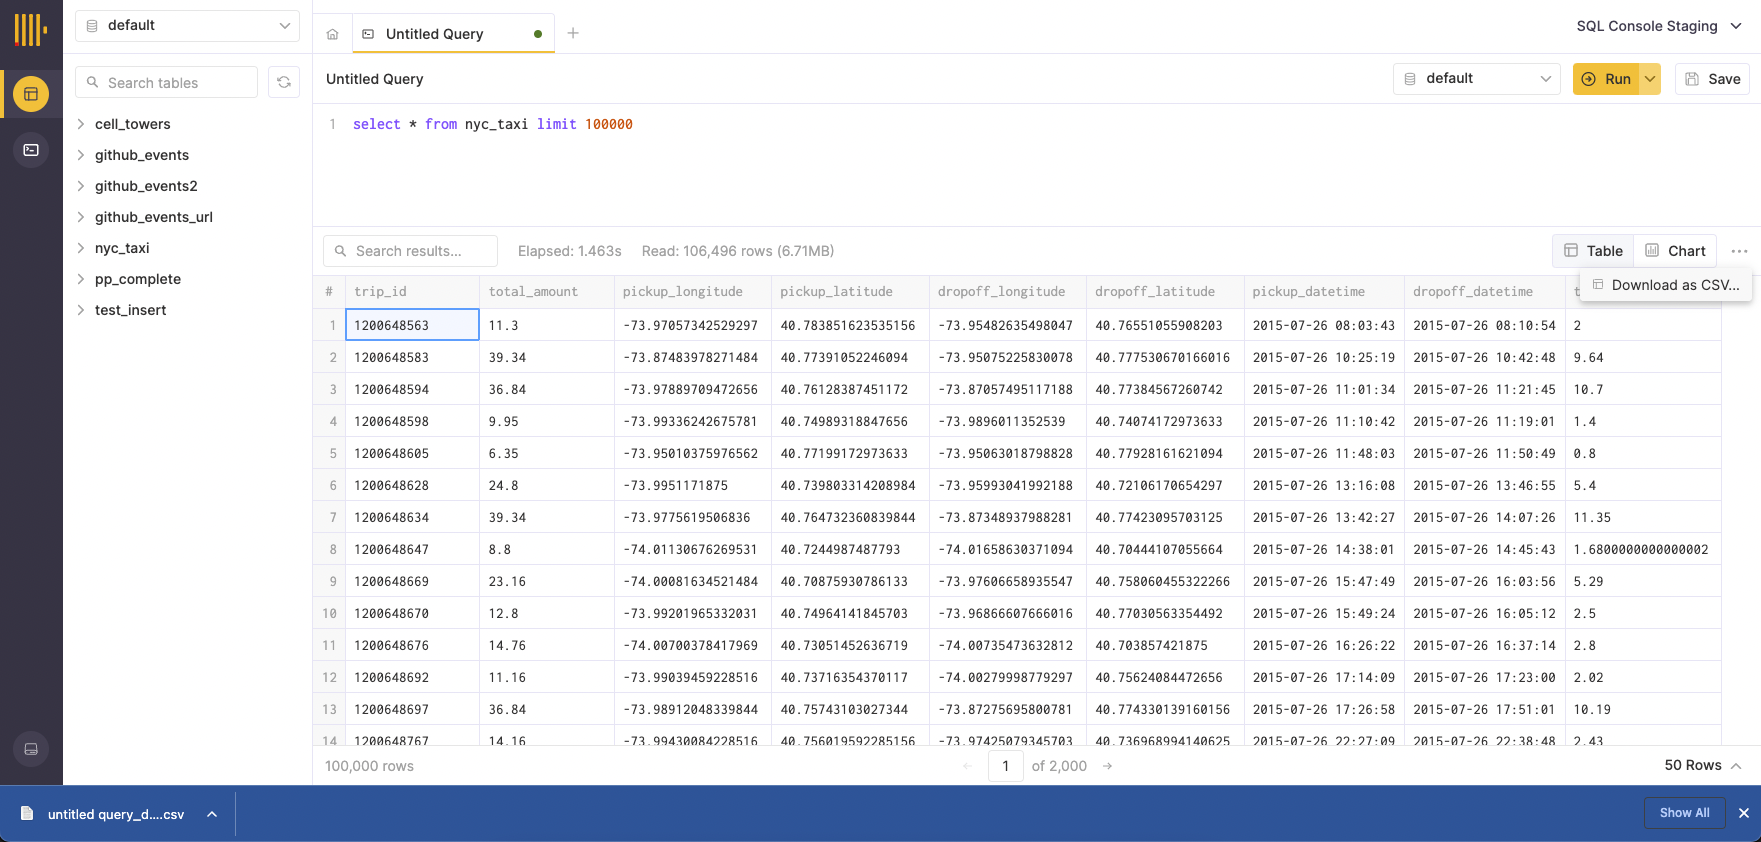
Exporting query result data
Query result sets can be easily exported to CSV format directly from the SQL console. To do so, open the ••• menu on the right side of the result pane toolbar and select ‘Download as CSV’.
Visualizing Query Data
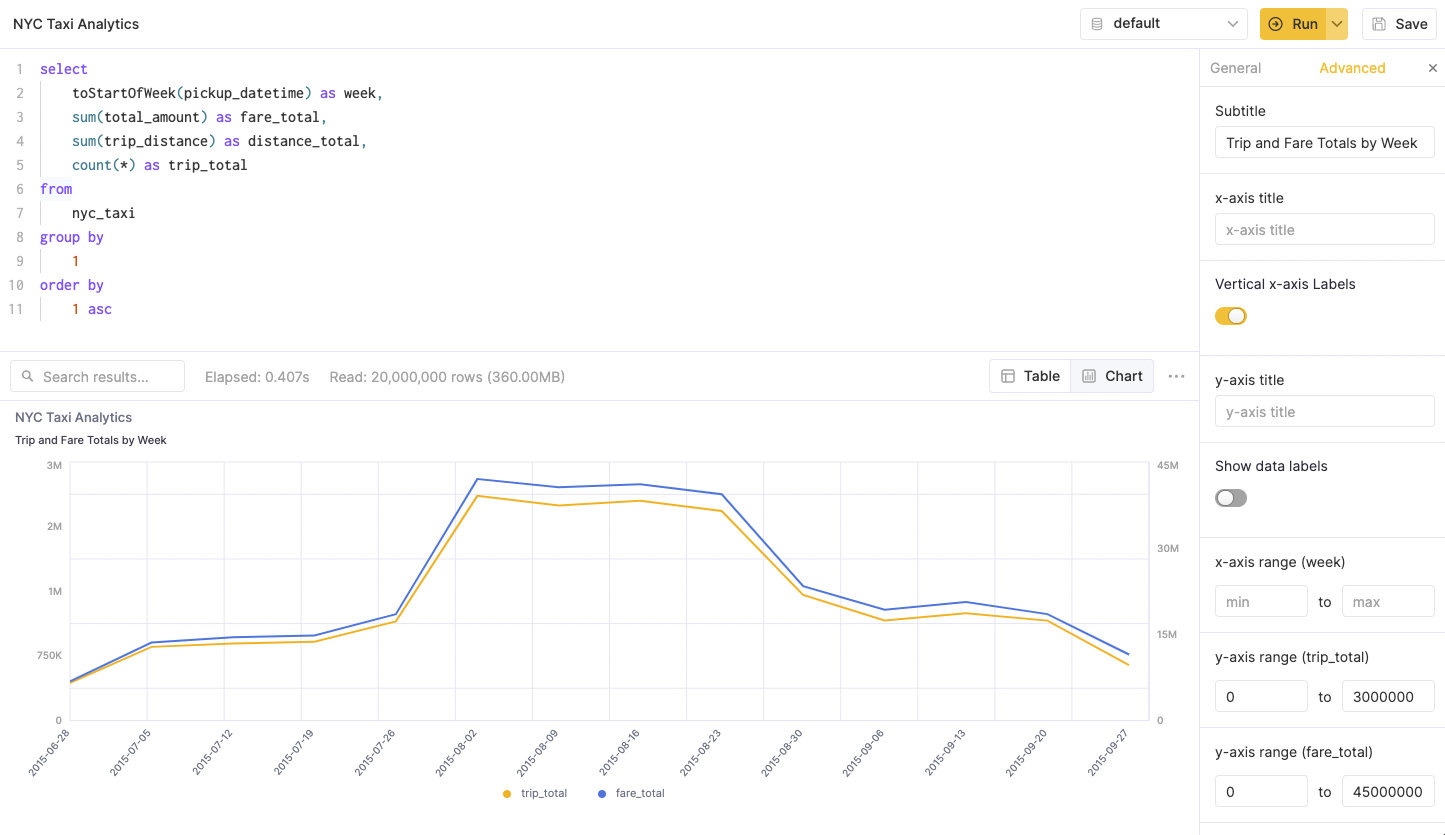
Some data can be more easily interpreted in chart form. You can quickly create visualizations from query result data directly from the SQL console in just a few clicks. As an example, we’ll use a query that calculates weekly statistics for NYC taxi trips:
select
   toStartOfWeek(pickup_datetime) as week,
   sum(total_amount) as fare_total,
   sum(trip_distance) as distance_total,
   count(*) as trip_total
from
   nyc_taxi
group by
   1
order by
   1 asc
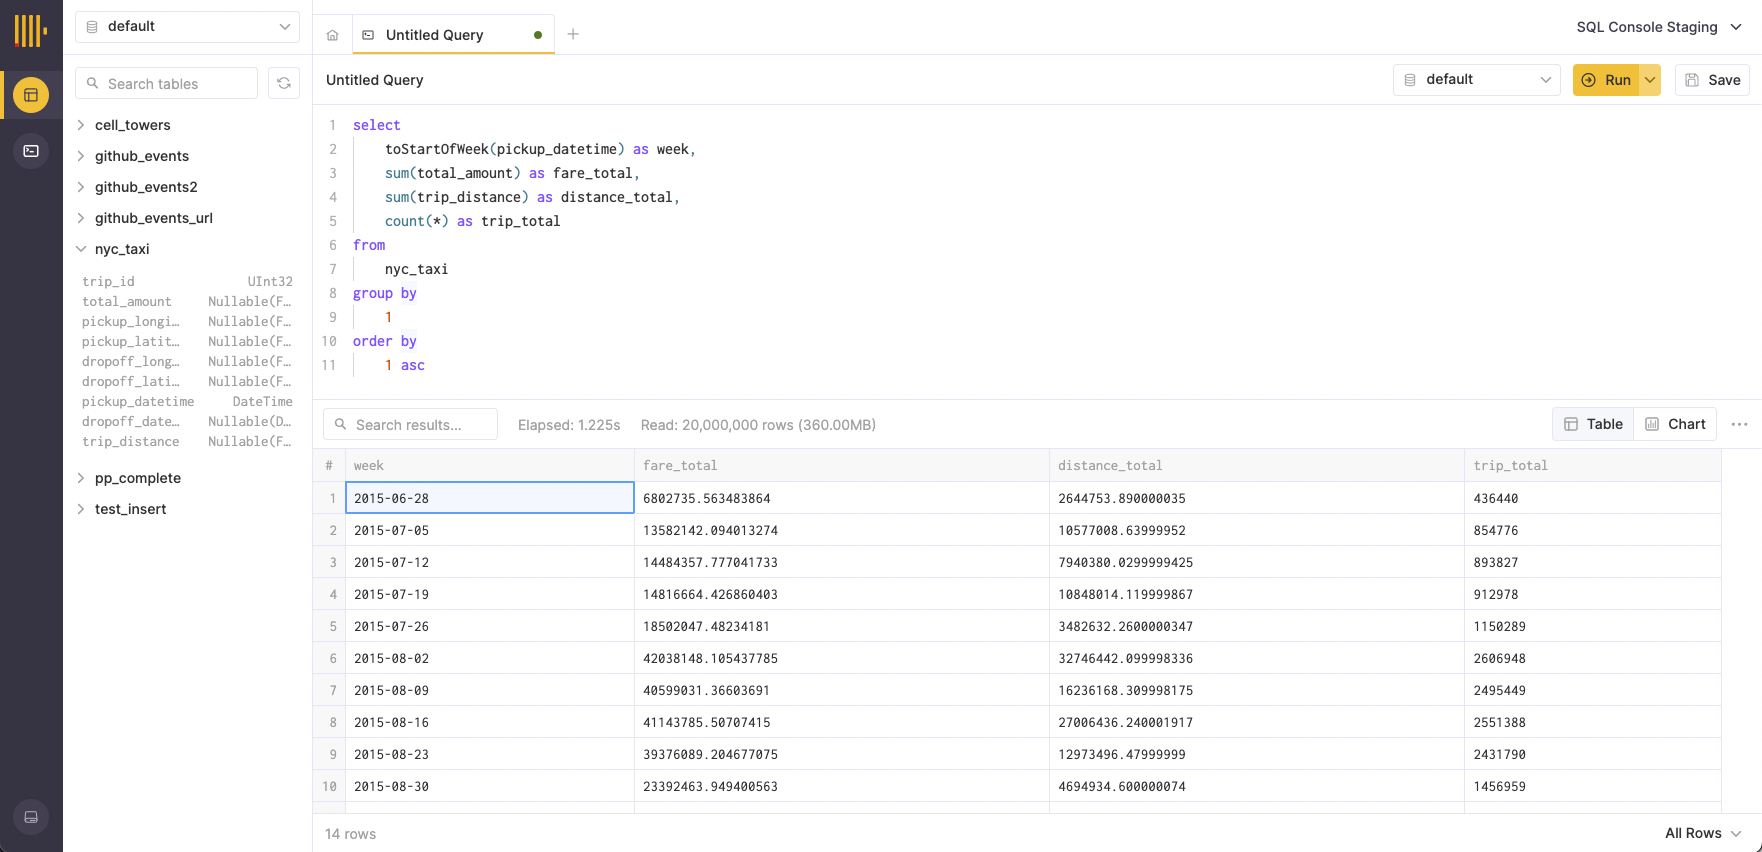
Without visualization, these results are difficult to interpret. Let’s turn them into a chart.
Creating charts
To begin building your visualization, select the ‘Chart’ option from the query result pane toolbar. A chart configuration pane will appear:
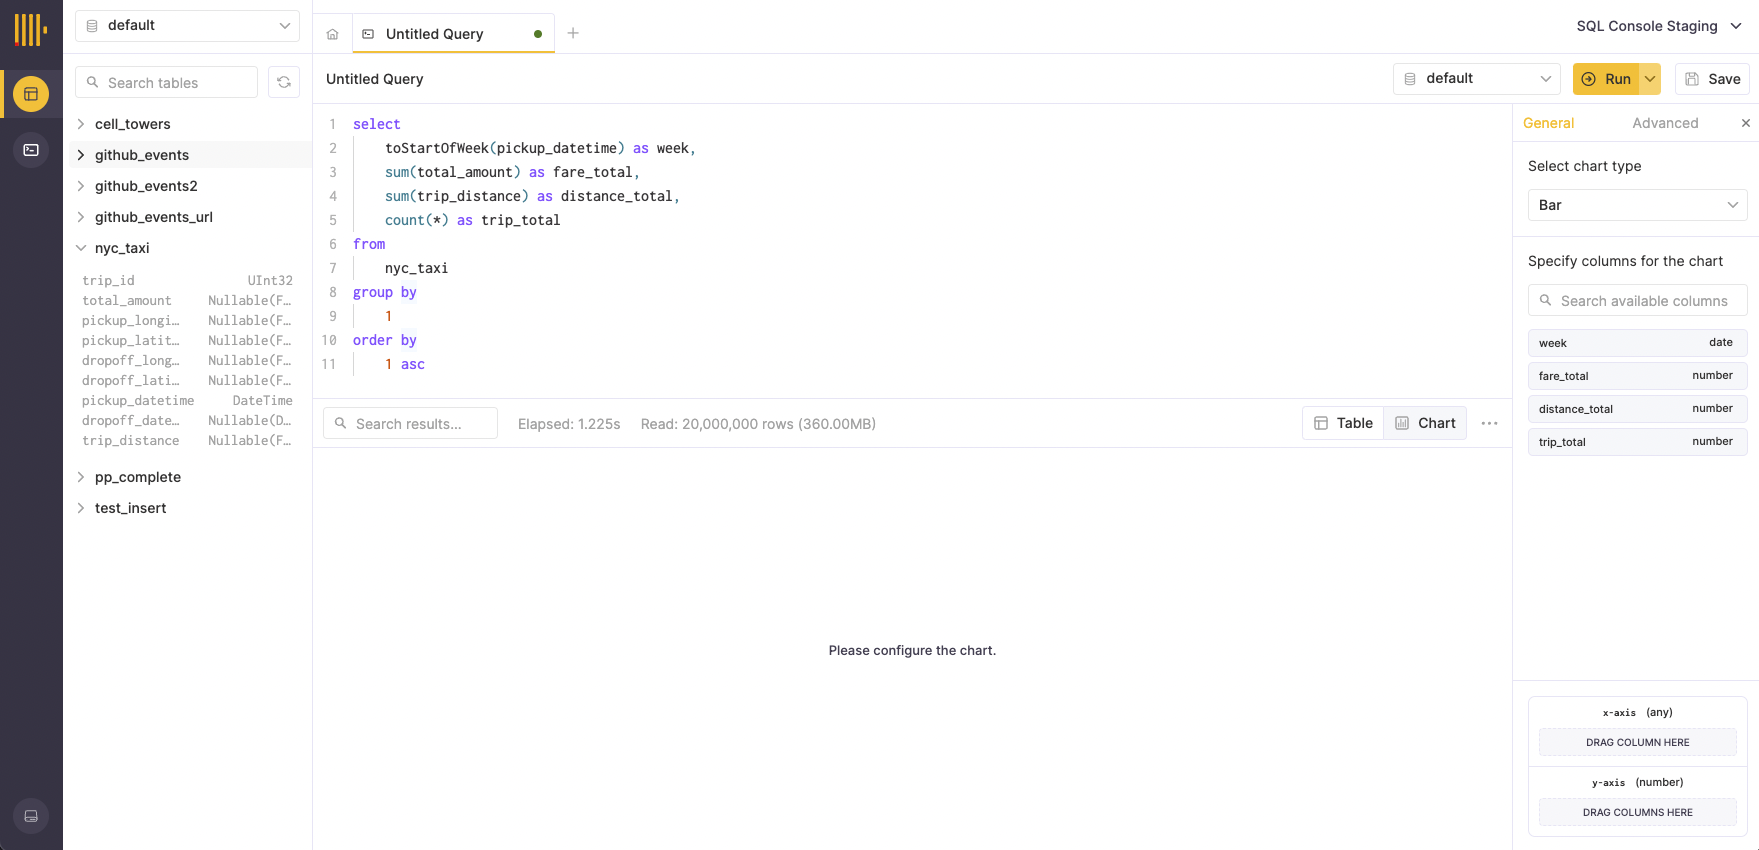
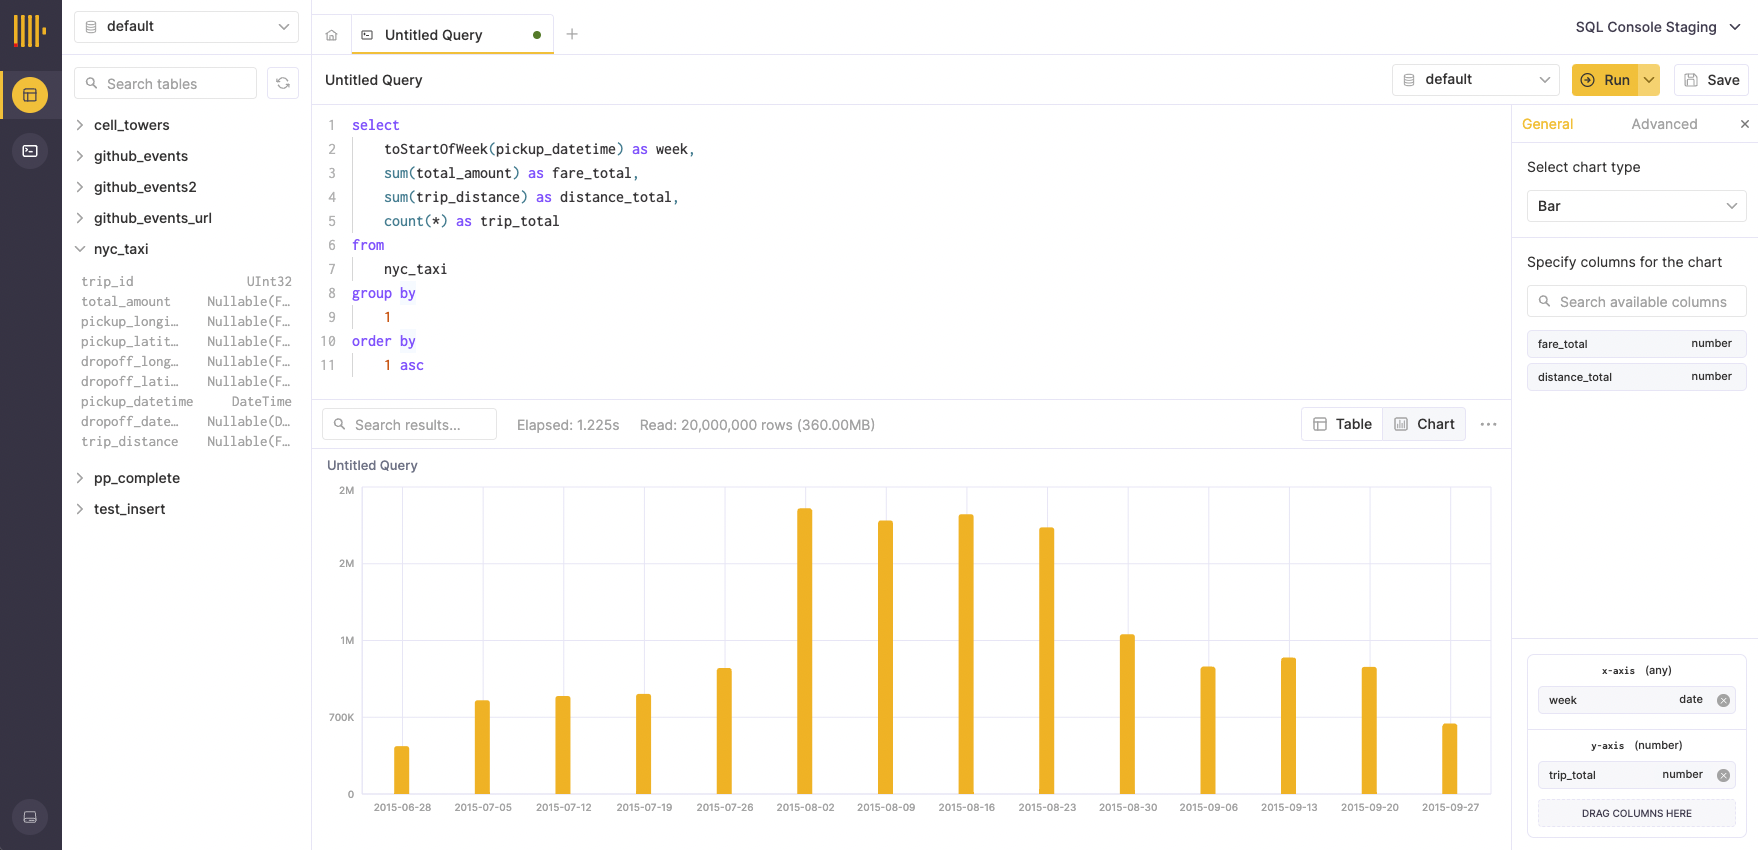
We’ll start by creating a simple bar chart tracking trip_total by week. To accomplish this, we’ll drag the week field to the x-axis and the trip_total field to the y-axis:
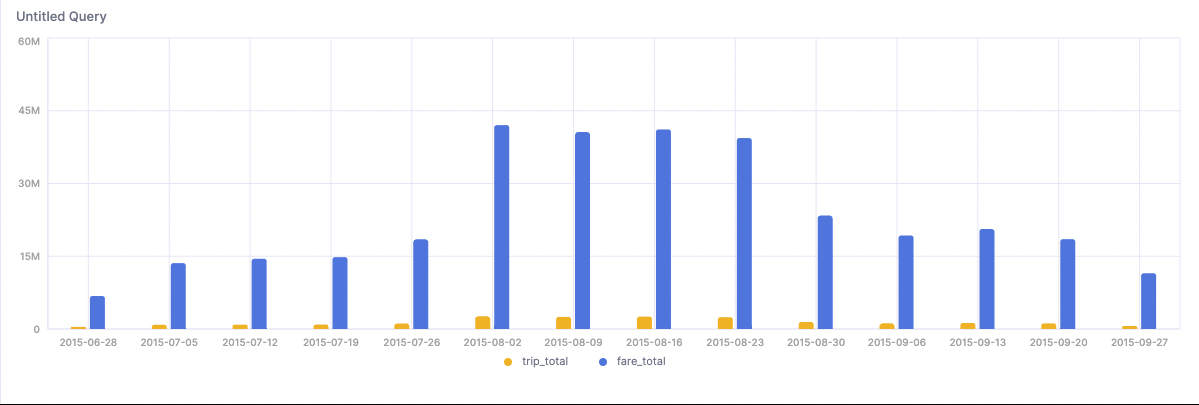
Most chart types support multiple fields on numeric axes. To demonstrate, we’ll drag the fare_total field onto the y-axis:
Customizing charts
The SQL console supports ten chart types that can be selected from the chart type selector in the chart configuration pane. For example, we can easily change the previous chart type from Bar to an Area:
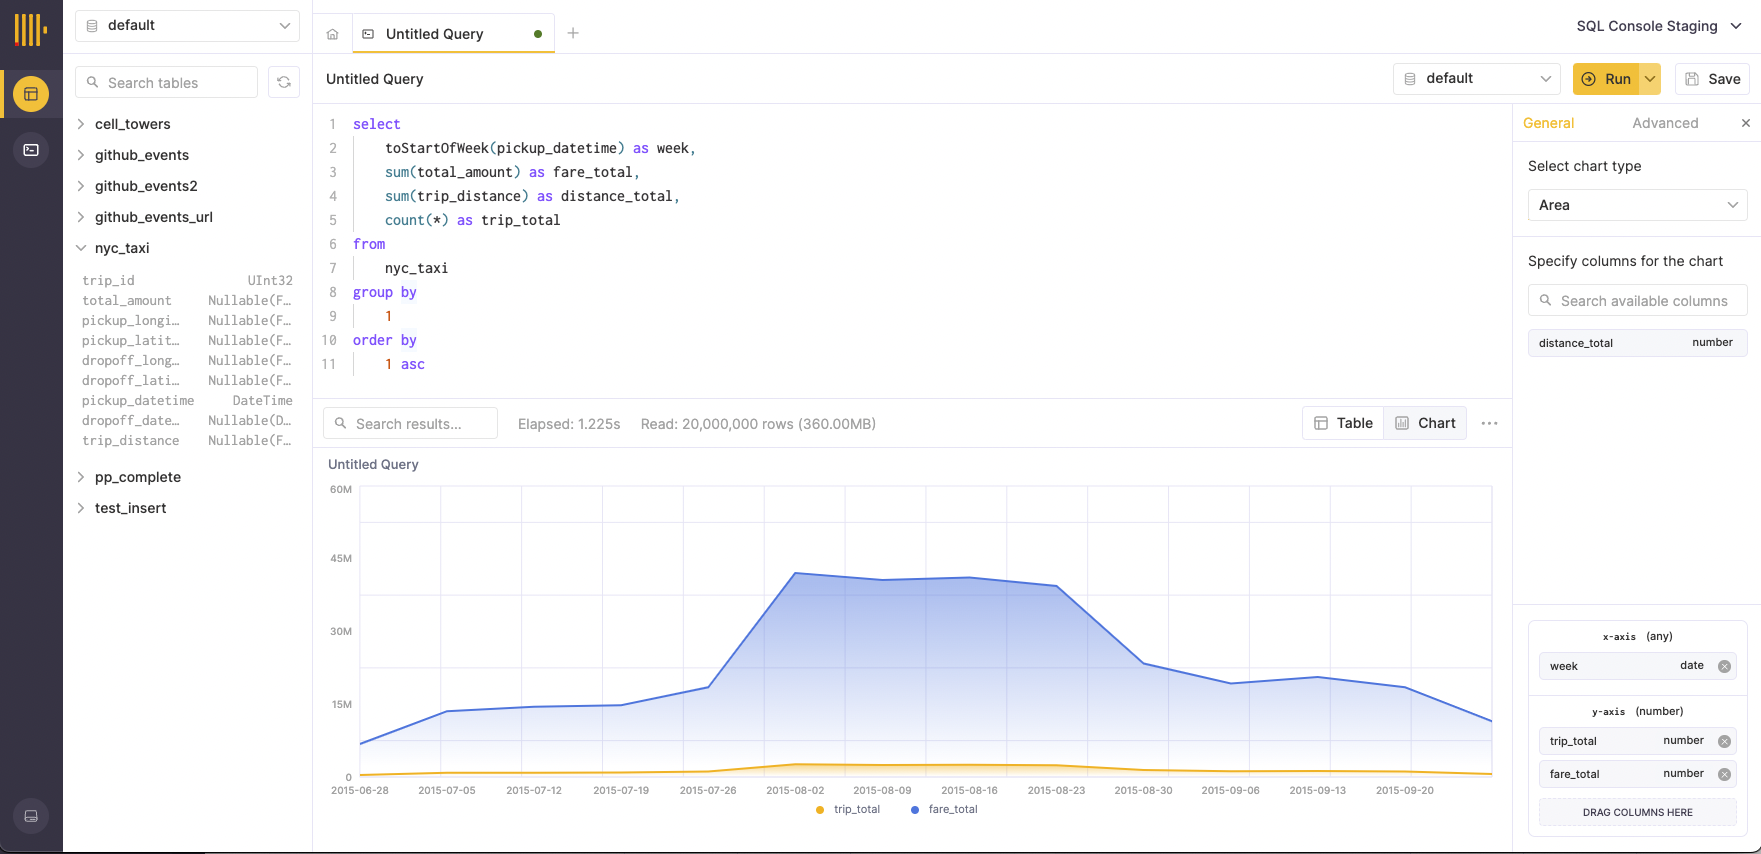
Chart titles match the name of the query supplying the data. Updating the name of the query will cause the Chart title to update as well:
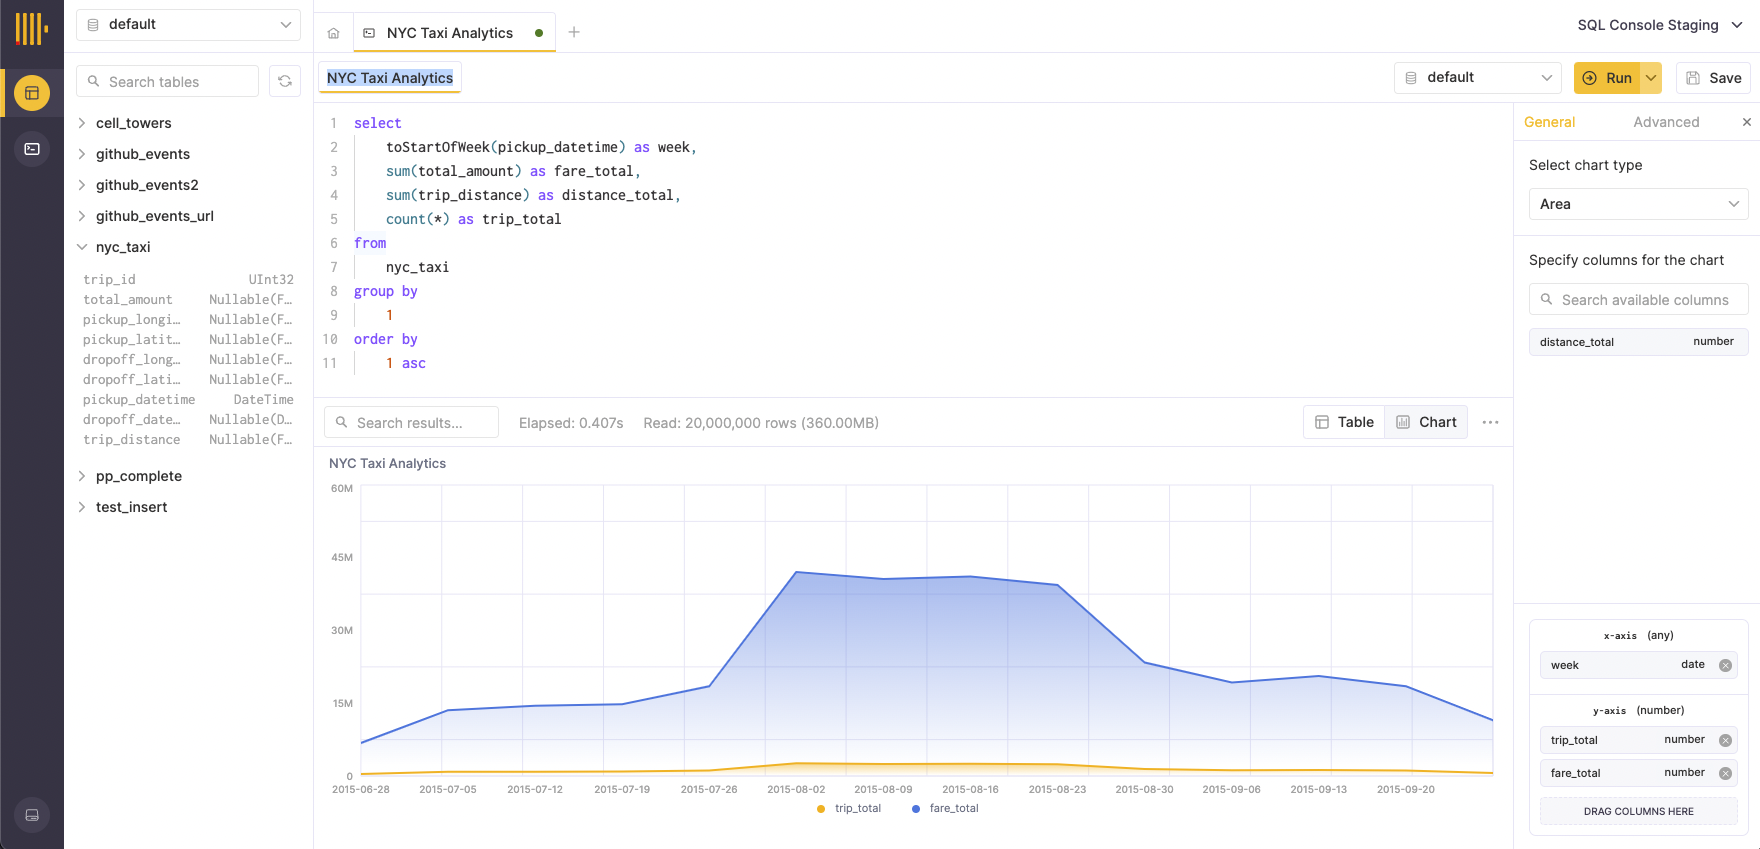
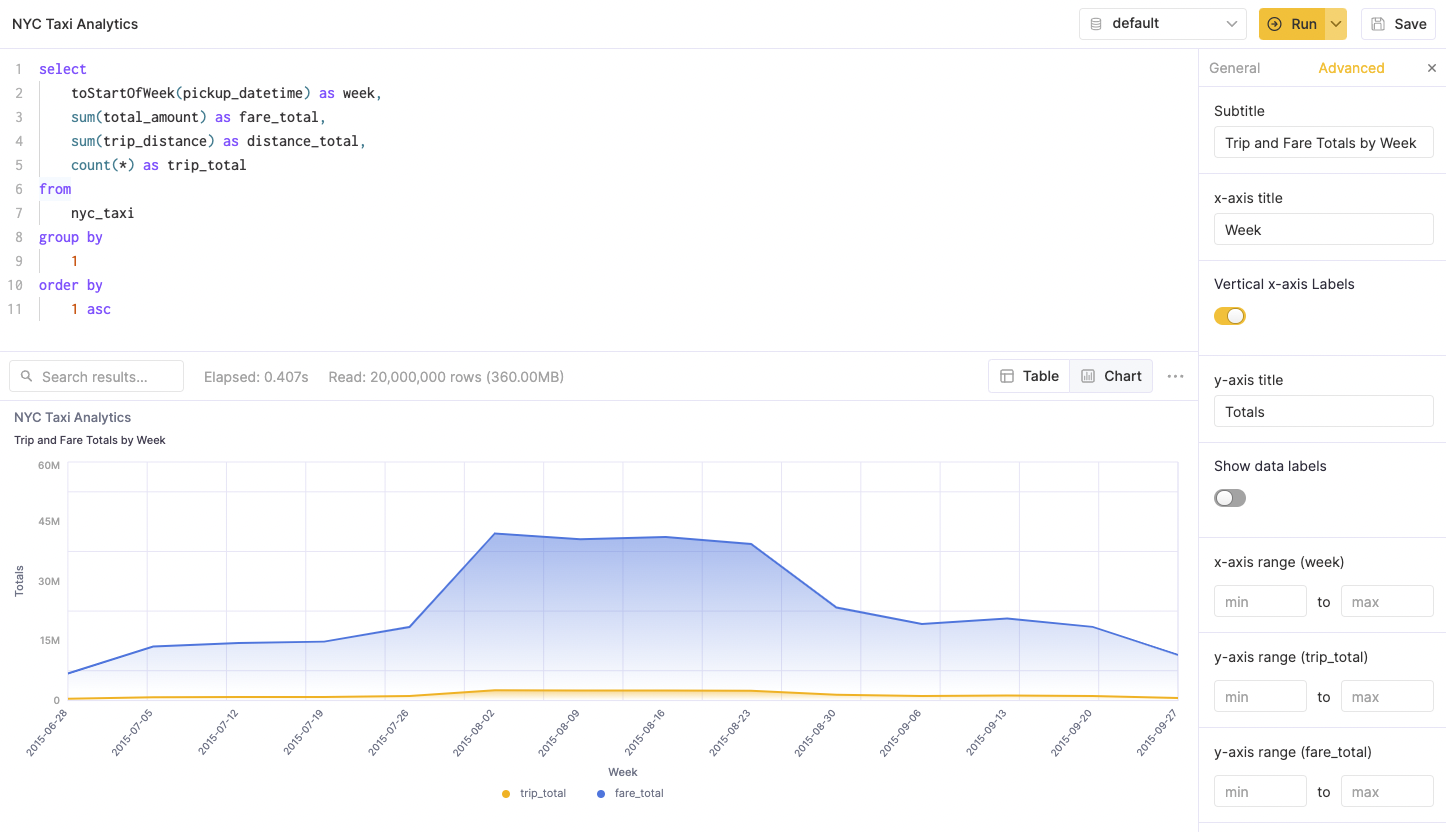
A number of more advanced chart characteristics can also be adjusted in the ‘Advanced’ section of the chart configuration pane. To begin, we’ll adjust the following settings:
- Subtitle
- Axis titles
- Label orientation for the x-axis
Our chart will be updated accordingly:
In some scenarios, it may be necessary to adjust the axis scales for each field independently. This can also be accomplished in the ‘Advanced’ section of the chart configuration pane by specifying min and max values for an axis range. As an example, the above chart looks good, but in order to demonstrate the correlation between our trip_total and fare_total fields, the axis ranges need some adjustment:
